Free Access
Fig. A.1
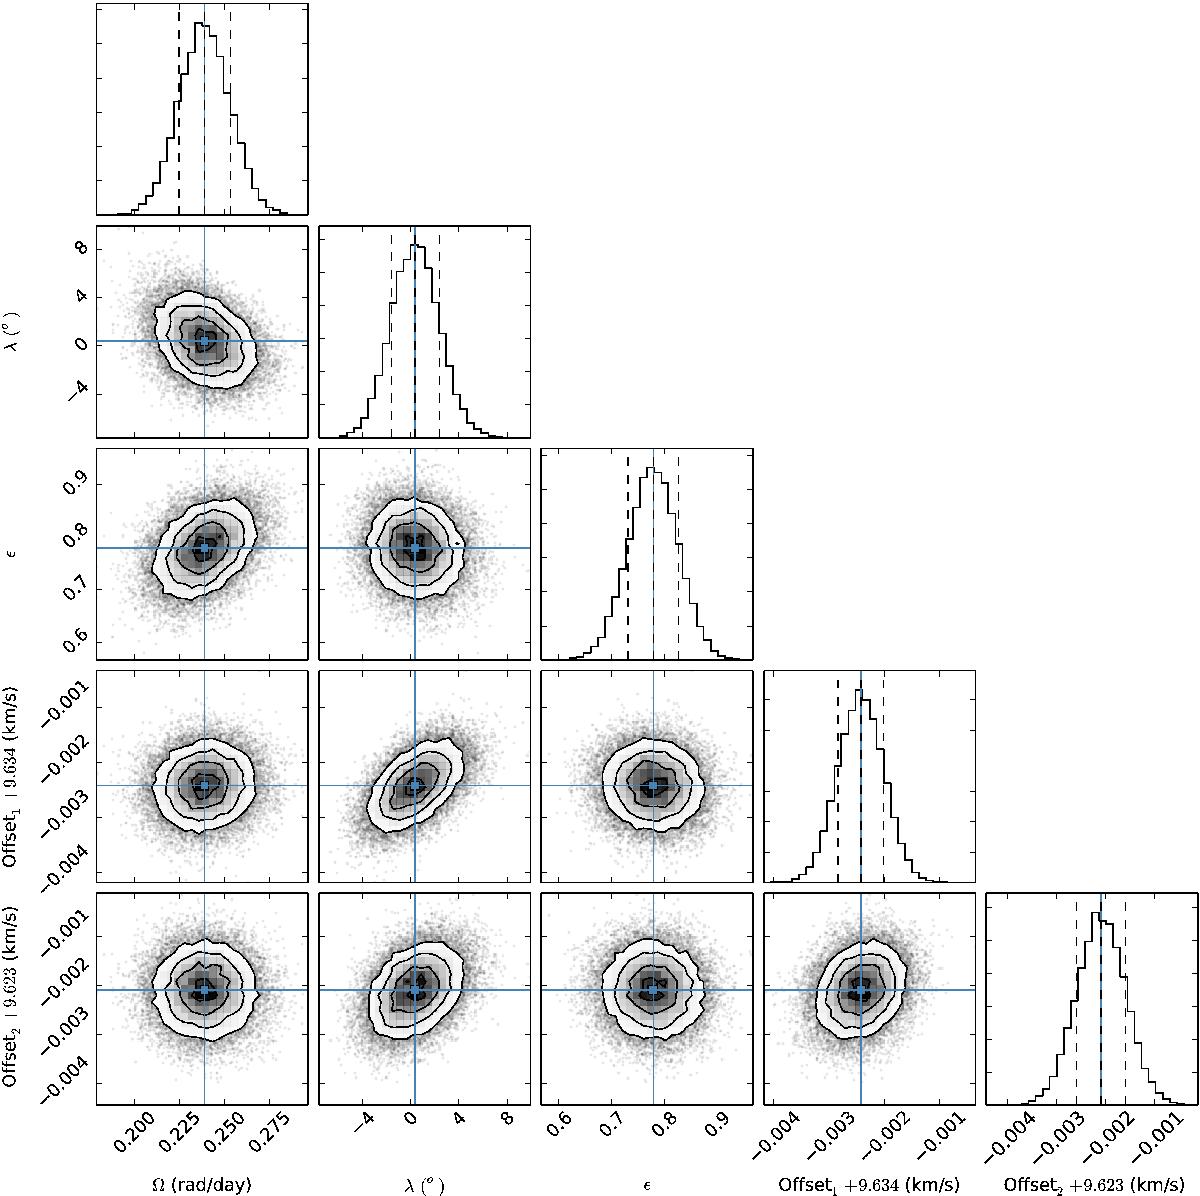
Correlation diagrams for the probability distribution of the RM model parameters for WASP-69b. The dashed lines on the histograms correspond to the 16 and 84 percentiles used to obtain the 1σ statistical errors. The blue lines show the resulting median values.
Current usage metrics show cumulative count of Article Views (full-text article views including HTML views, PDF and ePub downloads, according to the available data) and Abstracts Views on Vision4Press platform.
Data correspond to usage on the plateform after 2015. The current usage metrics is available 48-96 hours after online publication and is updated daily on week days.
Initial download of the metrics may take a while.