Fig. 11
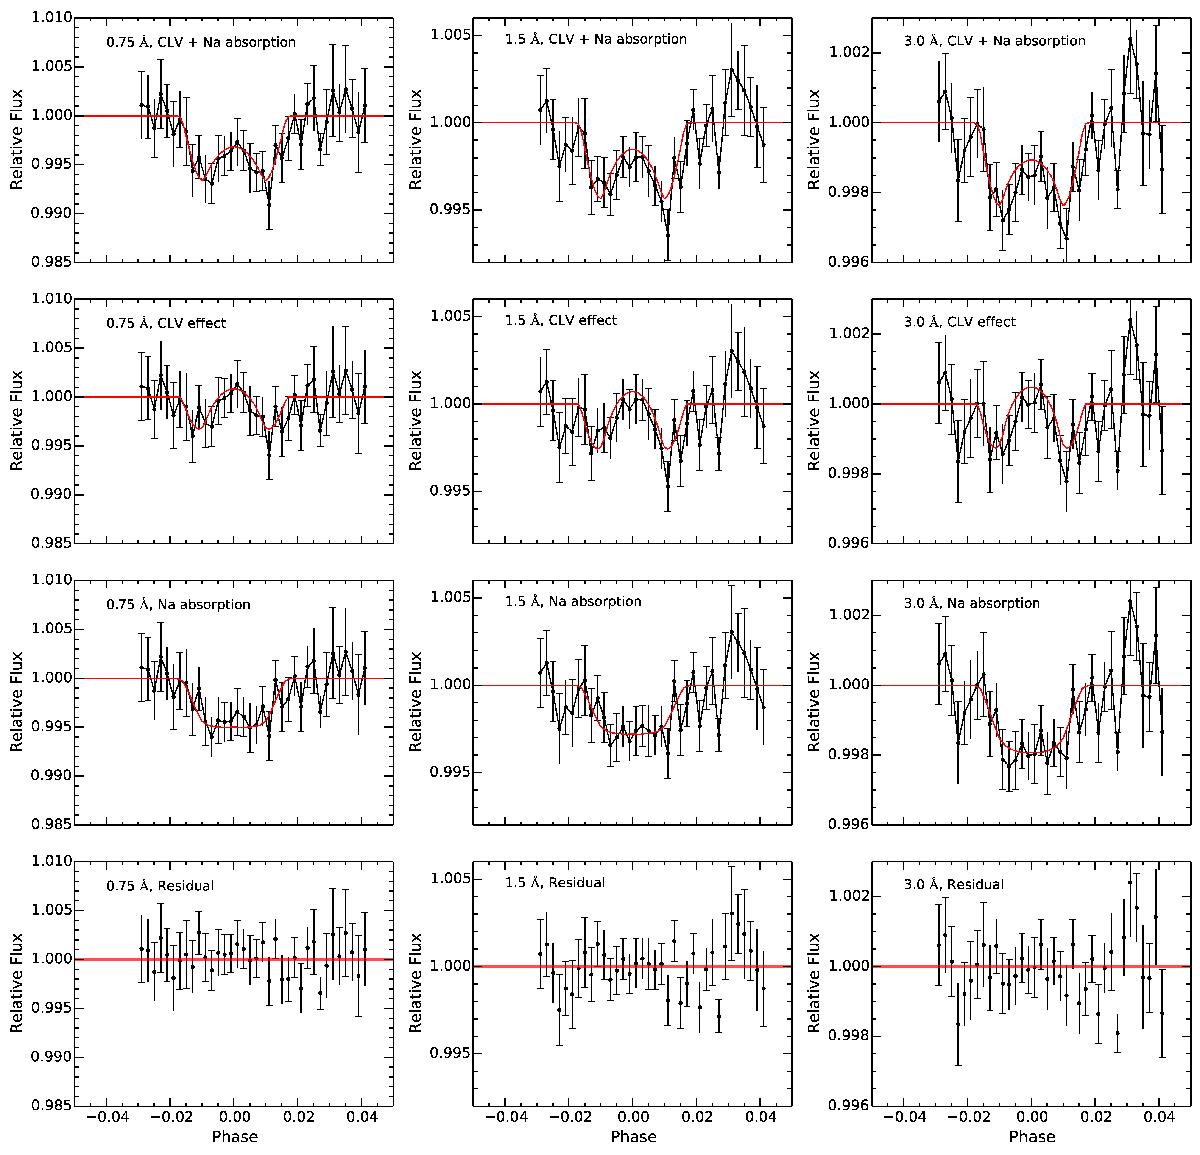
Transmission light curves from HARPS observations of HD 189733b, for three different bandwidths: 0.75 Å (left column), 1.5 Å (middle column), and 3.0 Å (right column). Only nights 1 and 3 are used here. First row: final observed transmission light curve of the Na I D lines from our data reduction. The relative flux of D1 and D2 lines is averaged and binned with a 0.002 phase step (black line). The red line is the modeled transmission light curve, which is the combination of the best-fit Na I absorption and the CLV effect (Yan et al. 2017). This model is calculated theoretically and there is no fitting to the actual data. Second row: the CLV effect. The black line is the result of removing the Na I absorption model from the observed transmission light curve. The modeled CLV effect is shown in red. Third row: the Na I absorption light curve obtained dividing the observed transmission light curve by the modeled CLV effect (black line). The red line is the best-fit Na I absorption model. Forth row: residuals between the observed transmission light curve and the model. The errorbars represent the photon noise within the passband.
Current usage metrics show cumulative count of Article Views (full-text article views including HTML views, PDF and ePub downloads, according to the available data) and Abstracts Views on Vision4Press platform.
Data correspond to usage on the plateform after 2015. The current usage metrics is available 48-96 hours after online publication and is updated daily on week days.
Initial download of the metrics may take a while.