Fig. 10
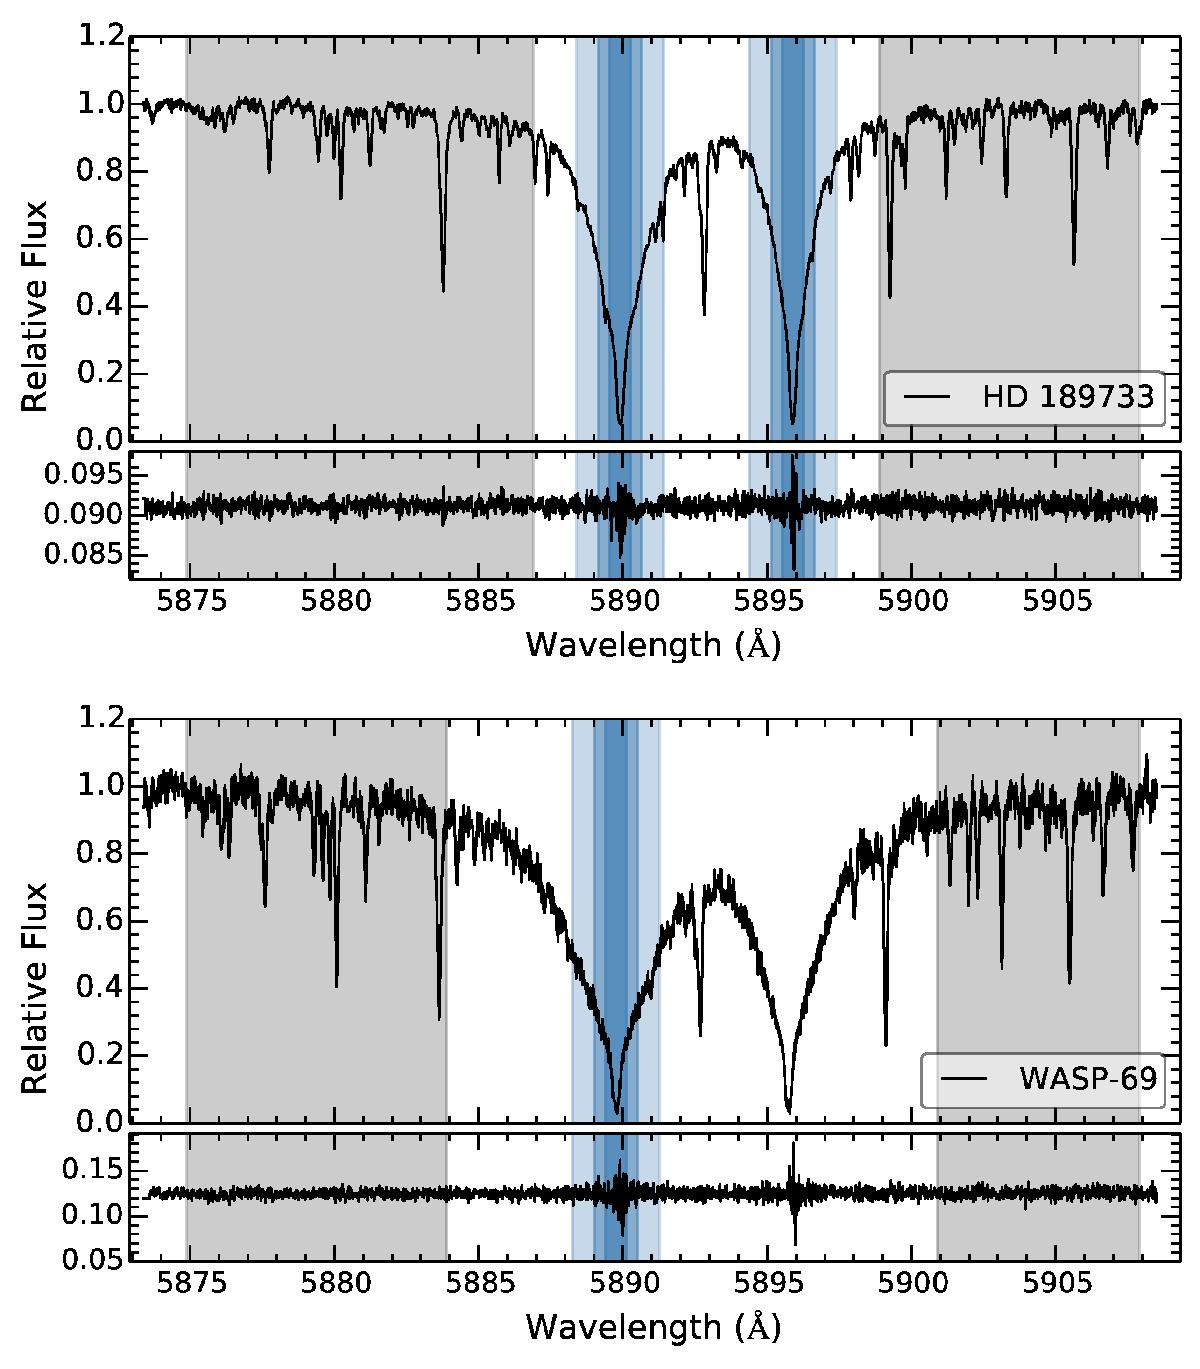
Passbands used to perform the transmission light curves of HD 189733b (upper panel) and WASP-69b (lower panel). One observed spectrum is shown on the top of each panel and the ratio between this single in-transit spectrum and the master out is shown on the bottom. The blue regions mark the three different bandwidths (0.75 Å, 1.5 Å and 3.0 Å) centered at the line cores of D1 and D2, and the blue and red reference passbands used to measure the relative flux and calculate the transmission light curves are shown in gray. We note that, for WASP-69, only the D2 line is used.
Current usage metrics show cumulative count of Article Views (full-text article views including HTML views, PDF and ePub downloads, according to the available data) and Abstracts Views on Vision4Press platform.
Data correspond to usage on the plateform after 2015. The current usage metrics is available 48-96 hours after online publication and is updated daily on week days.
Initial download of the metrics may take a while.