Fig. 8
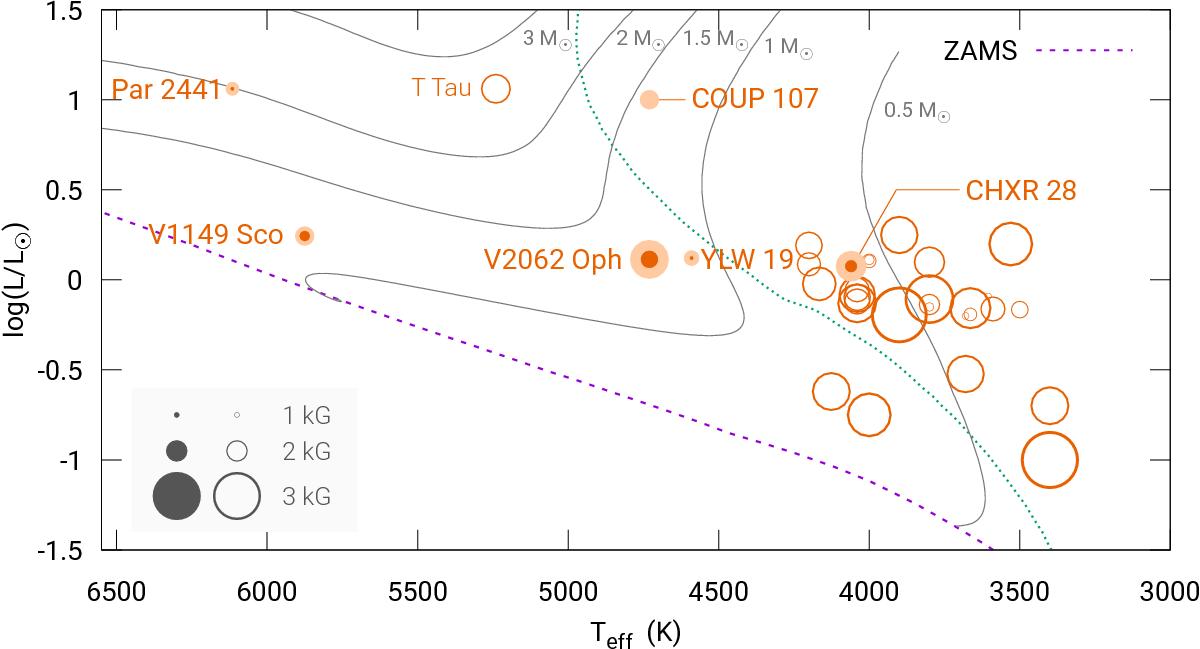
HR diagram position of T Tauri stars with magnetic field measurements from near-IR spectroscopy from this work (filled circles) and from the literature (open circles). The radius of the circles is proportional to the square of the magnetic field strength. Filled light orange and filled dark orange circles represent ⟨ B ⟩1.5 and ⟨ B ⟩3 measurements, respectively, from Table 4. We overplot the zero age main sequence (ZAMS; dashed purple line), the evolutionary tracks for 0.5, 1, 2, and 3 M⊙ (dark lines), and the limit between fully convective and partially convective interiors (dotted green line) from the Yale–Potsdam Stellar Isochrones grid (Spada et al. 2017). The key in the lower left corner gives the corresponding symbol sizes for magnetic field strengths of 1, 2, and 3 kG.
Current usage metrics show cumulative count of Article Views (full-text article views including HTML views, PDF and ePub downloads, according to the available data) and Abstracts Views on Vision4Press platform.
Data correspond to usage on the plateform after 2015. The current usage metrics is available 48-96 hours after online publication and is updated daily on week days.
Initial download of the metrics may take a while.