Free Access
Fig. 6
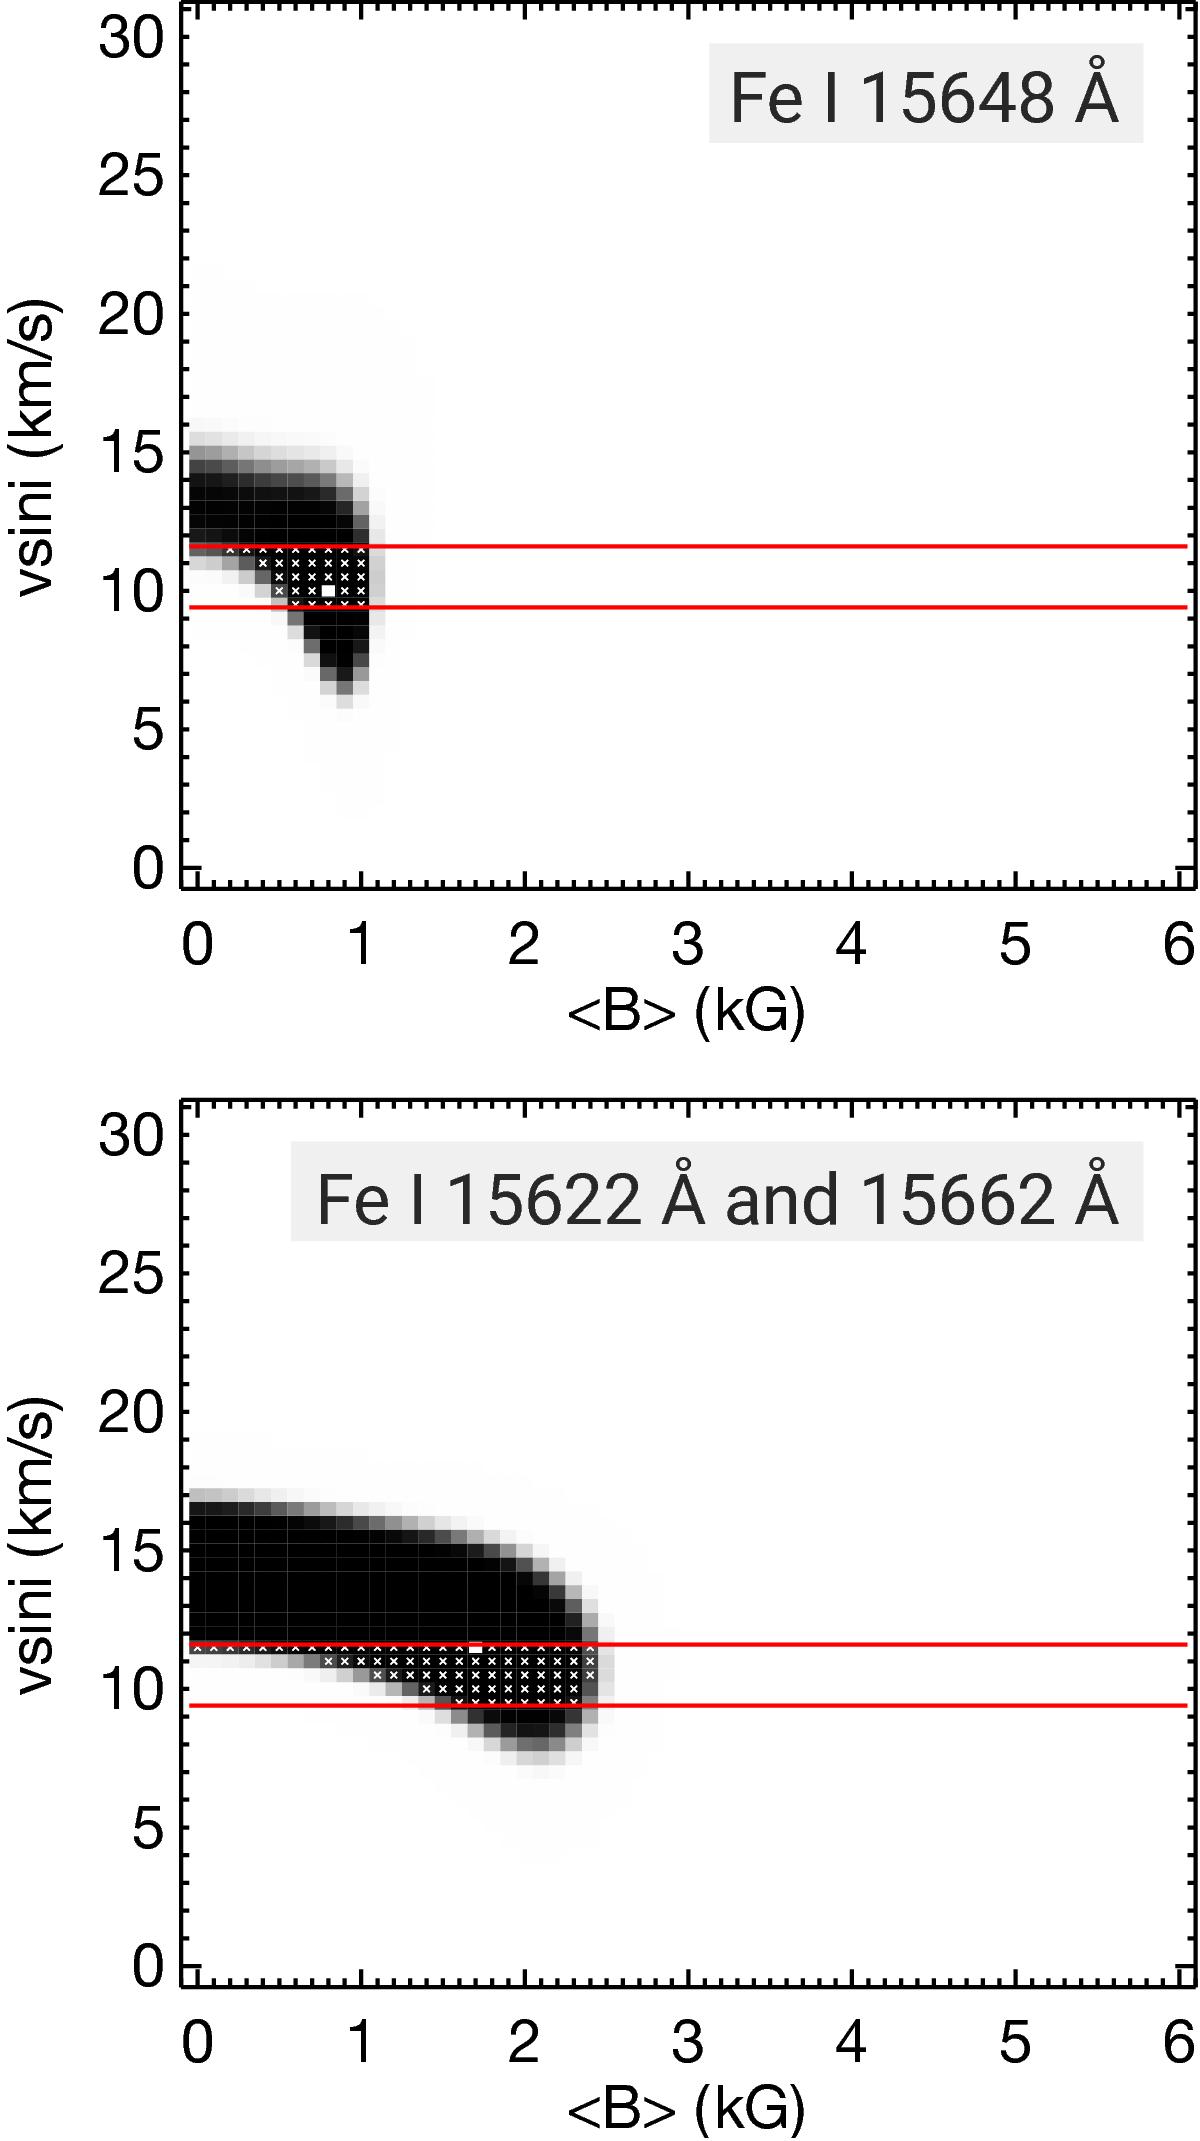
χ2 map for the three lines of interest. Fe i 15 648.5 Å (top), Fe i 15 622 Å and Fe i 15 662 Å (bottom) for YLW 19 are shown. The small white rectangle indicates the minimum χ2 and the white crosses indicate values within 1σ from the minimum and within the 1σ limits on v sin i indicated by the horizontal red lines.
Current usage metrics show cumulative count of Article Views (full-text article views including HTML views, PDF and ePub downloads, according to the available data) and Abstracts Views on Vision4Press platform.
Data correspond to usage on the plateform after 2015. The current usage metrics is available 48-96 hours after online publication and is updated daily on week days.
Initial download of the metrics may take a while.