Free Access
Fig. 5
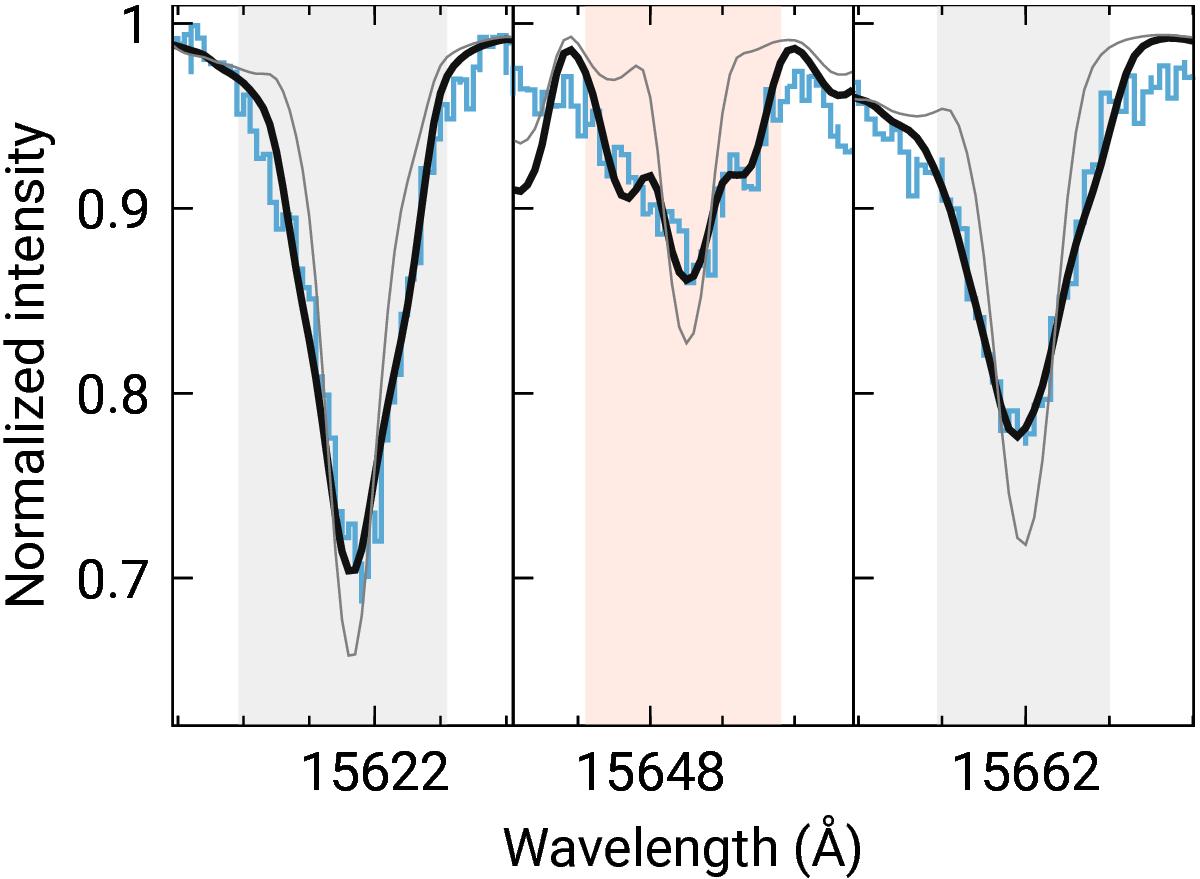
Comparison of the observed spectra (blue histogram), the magnetic synthetic spectra, yielding the best fit to the observations (black thick line) and the non-magnetic synthetic spectra (grey thin line) for the three lines of interest Fe i 15 622 Å (left), Fe i 15 648.5 Å (middle), and Fe i 15 662 Å (right) of CHXR 28.
Current usage metrics show cumulative count of Article Views (full-text article views including HTML views, PDF and ePub downloads, according to the available data) and Abstracts Views on Vision4Press platform.
Data correspond to usage on the plateform after 2015. The current usage metrics is available 48-96 hours after online publication and is updated daily on week days.
Initial download of the metrics may take a while.