Fig. 1
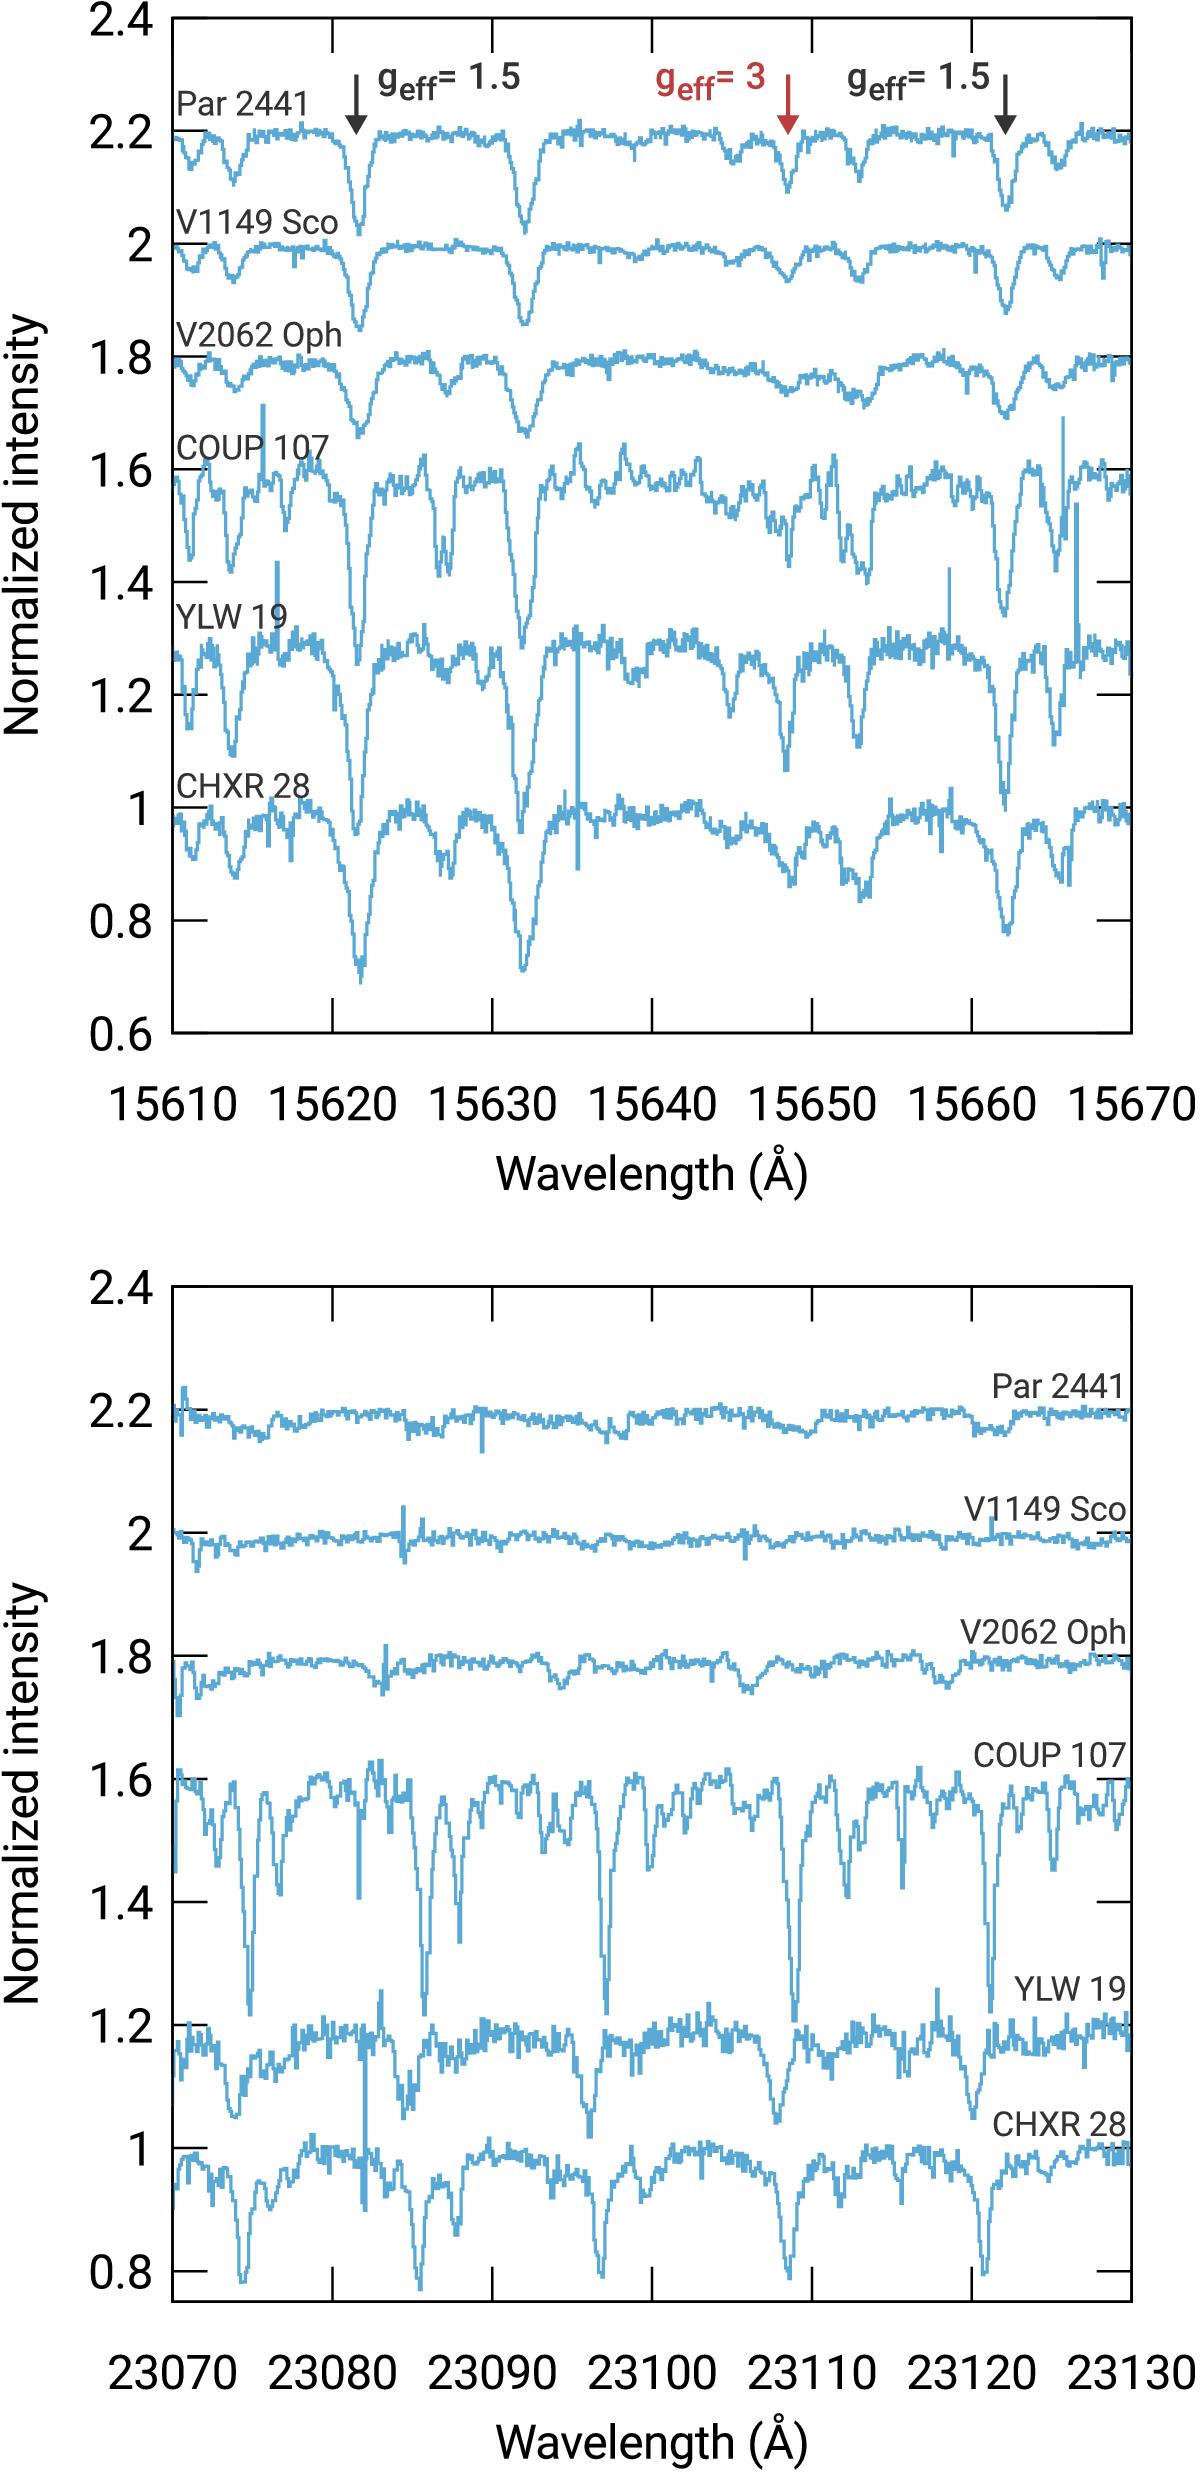
Normalized CRIRES spectra in the H band (upper panel) and the K band (lower panel). The spectra are shifted vertically with stellar effective temperature rising upwards. The arrows in the upper panel indicate the spectral lines used in the magnetic field analysis. The central arrow indicates the magnetically sensitive spectral line Fe i 15 648.5 Å with geff = 3.
Current usage metrics show cumulative count of Article Views (full-text article views including HTML views, PDF and ePub downloads, according to the available data) and Abstracts Views on Vision4Press platform.
Data correspond to usage on the plateform after 2015. The current usage metrics is available 48-96 hours after online publication and is updated daily on week days.
Initial download of the metrics may take a while.