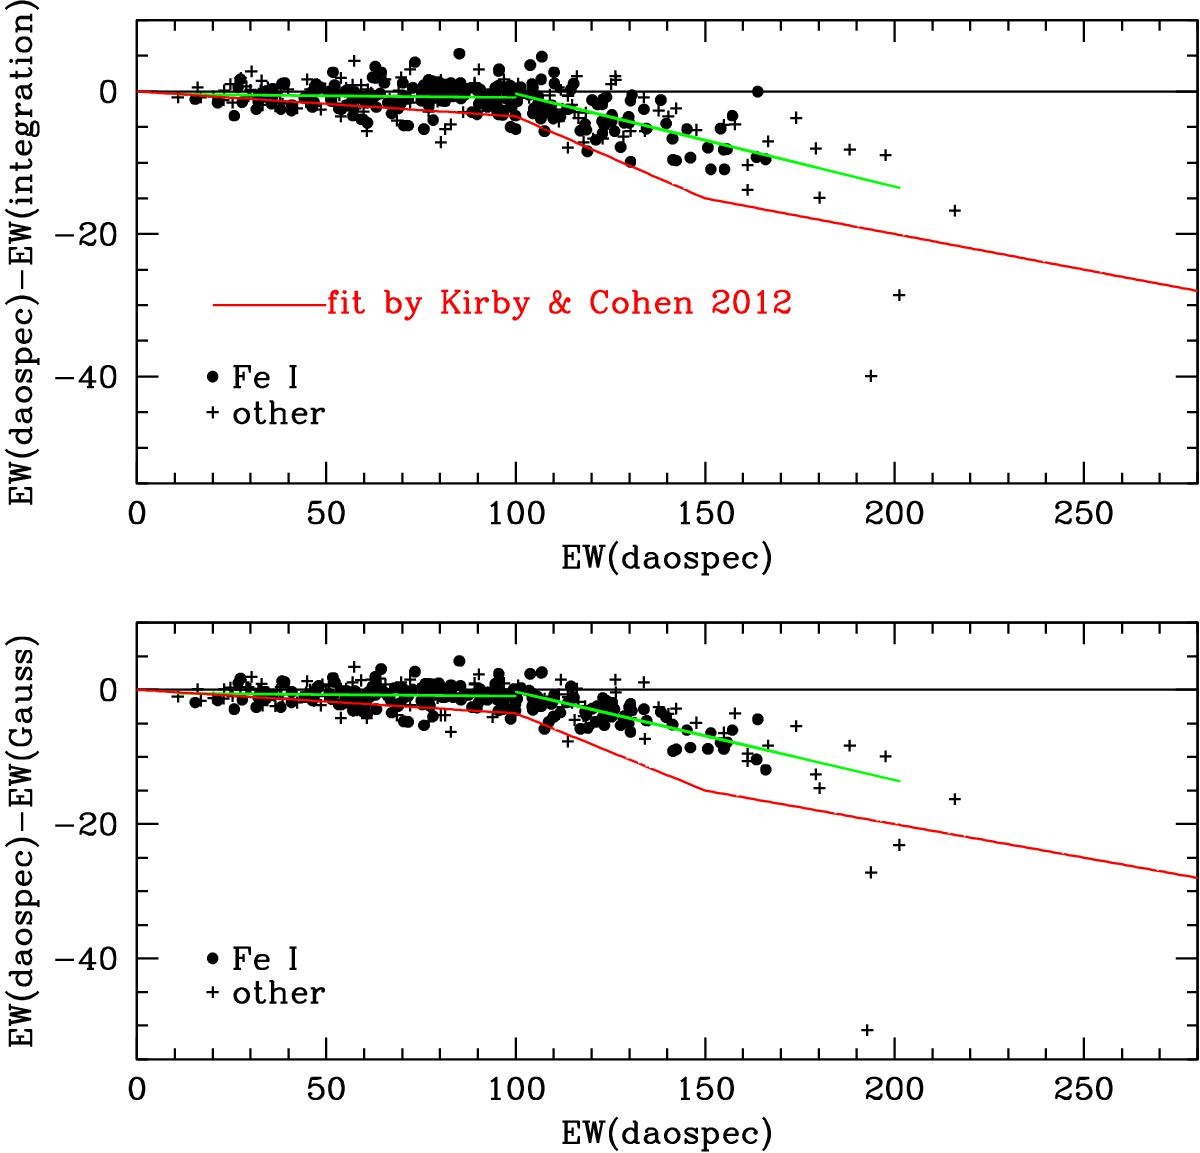
Fig. 3

Comparison of the EWs determined by DAOSPEC with those obtained by manual direct integration (top panel) and Gaussian fits (bottom panel) for clean lines, for all ten stars of the UVES sample. The red curve shows the bias found by Kirby & Cohen (2012) for their own spectra (R ≳ 60 000). The green lines show the linear regressions below and above 100 m Å.
Current usage metrics show cumulative count of Article Views (full-text article views including HTML views, PDF and ePub downloads, according to the available data) and Abstracts Views on Vision4Press platform.
Data correspond to usage on the plateform after 2015. The current usage metrics is available 48-96 hours after online publication and is updated daily on week days.
Initial download of the metrics may take a while.


