Free Access
Fig. 2
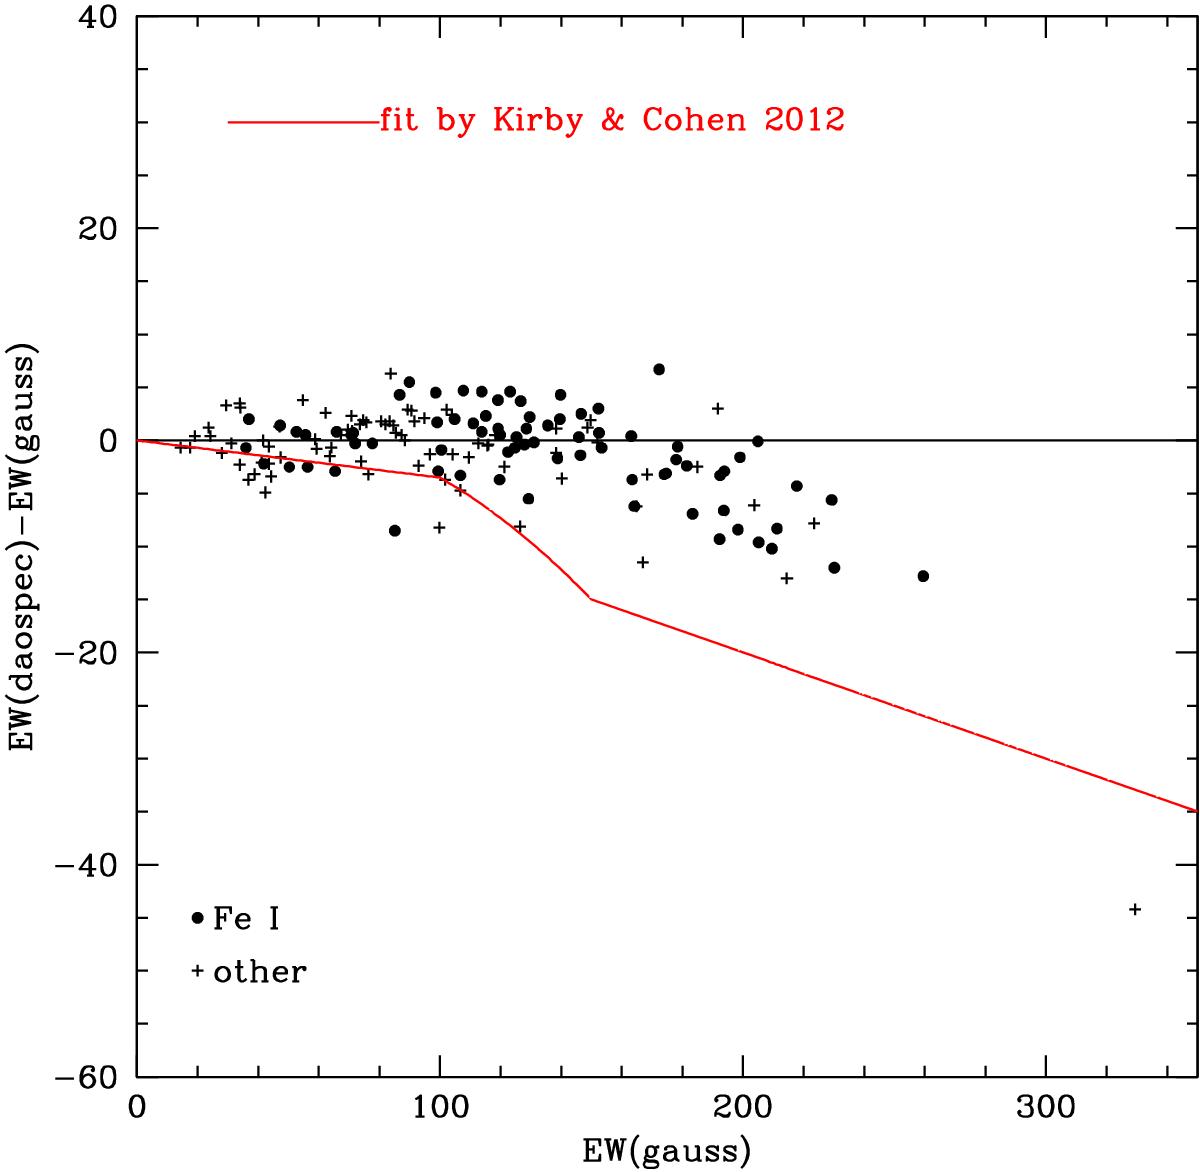
Comparison of the EWs determined by DAOSPEC with those obtained by “manual” Gaussian fits for clean lines, for star #13, of the MIKE sample. The red curve shows the bias found by Kirby & Cohen (2012) for their spectra with a resolution R ≳ 60 000.
Current usage metrics show cumulative count of Article Views (full-text article views including HTML views, PDF and ePub downloads, according to the available data) and Abstracts Views on Vision4Press platform.
Data correspond to usage on the plateform after 2015. The current usage metrics is available 48-96 hours after online publication and is updated daily on week days.
Initial download of the metrics may take a while.