Fig. 3
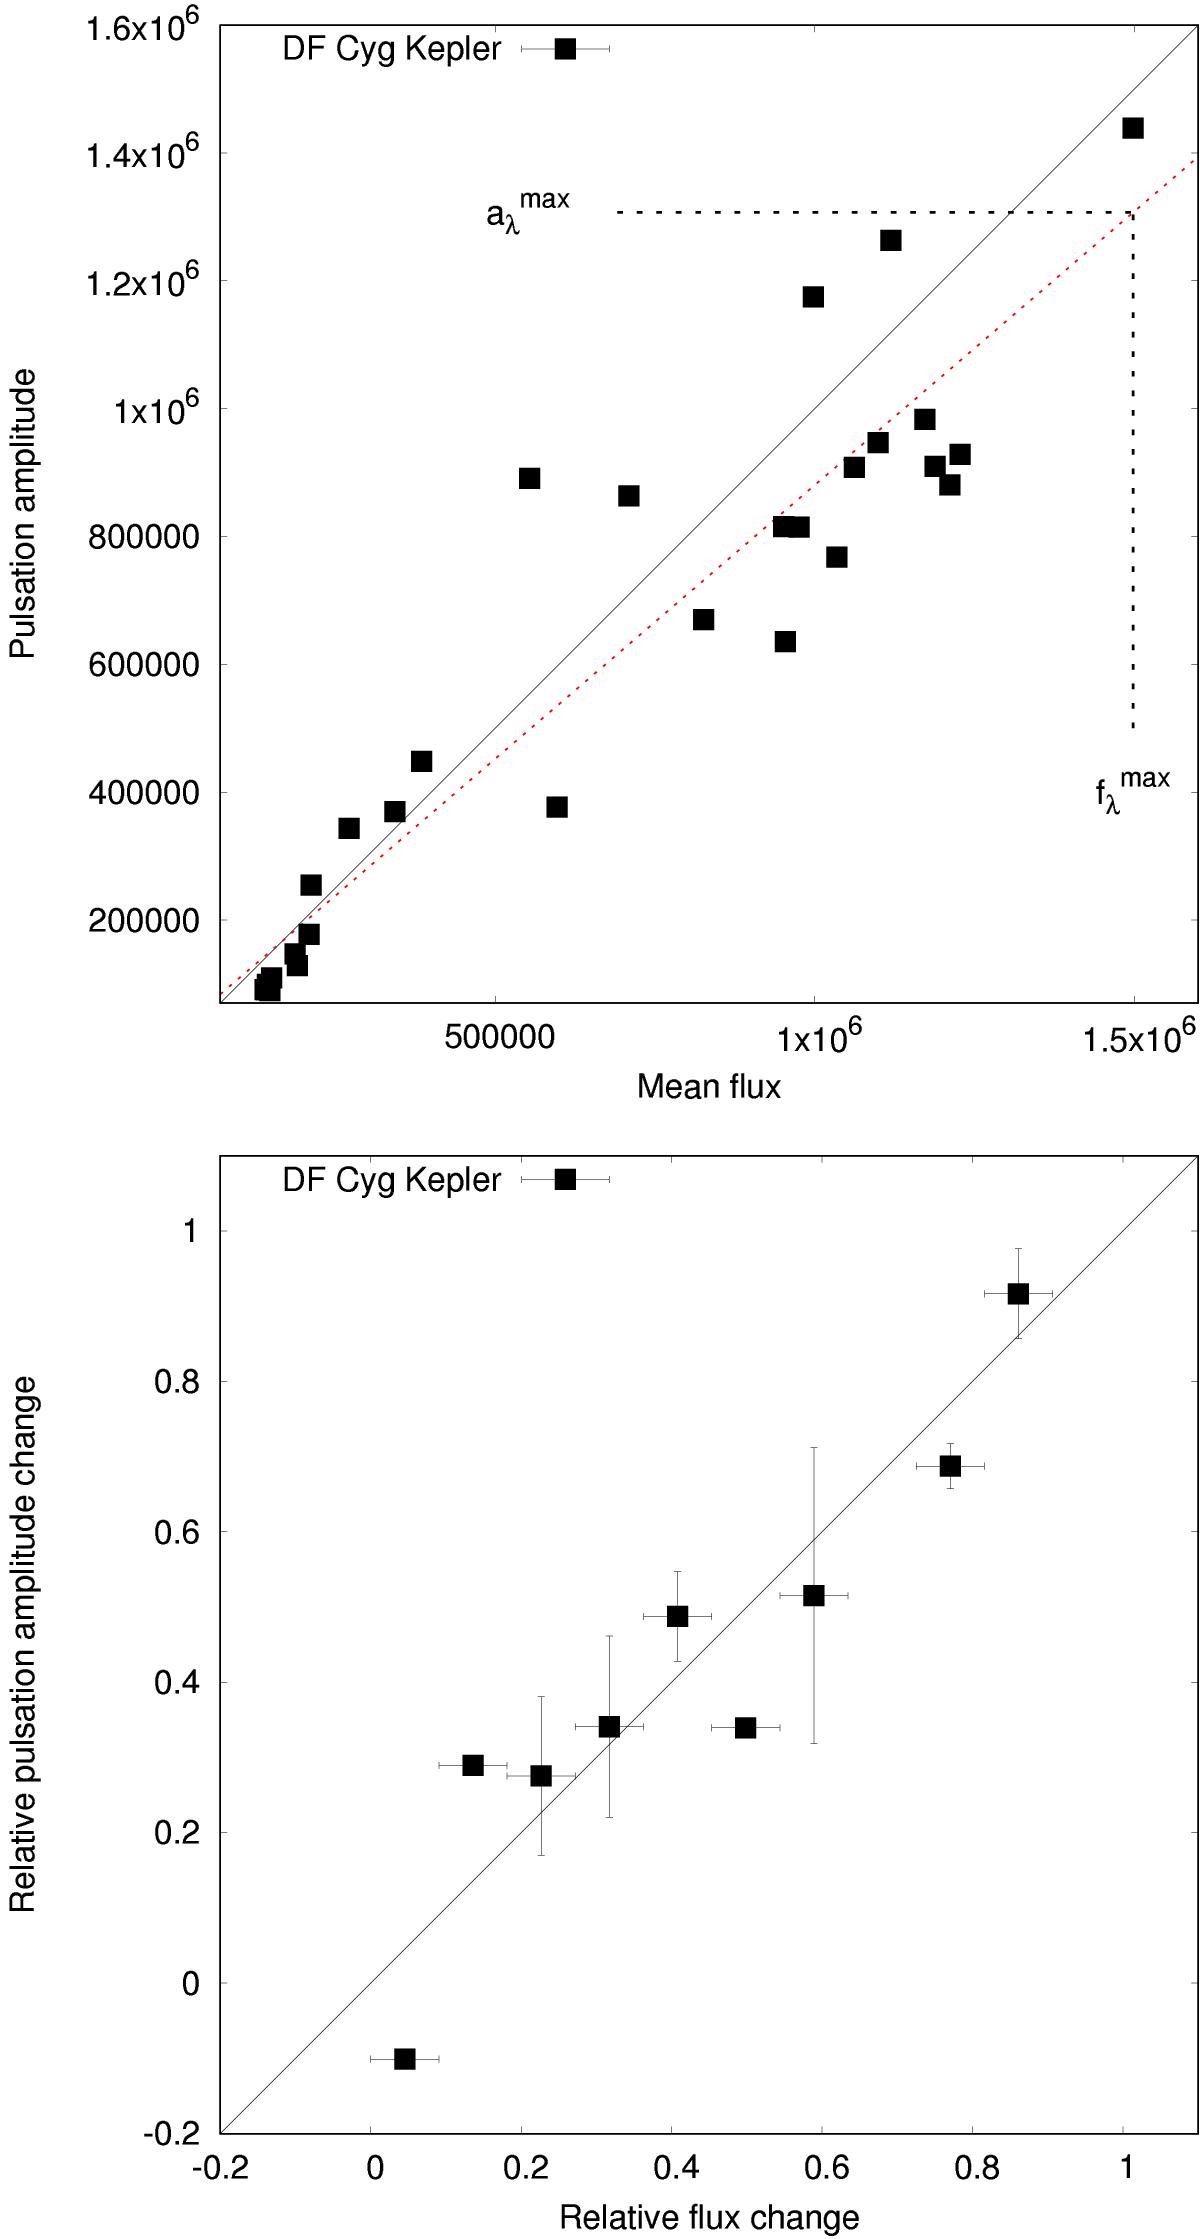
Pulsation amplitude as a function of the mean brightness for the Kepler data of DF Cyg. Top panel: instantaneous flux amplitudes versus mean fluxes in linear scaling. The dotted red line shows a linear fit to the data, which was used to estimate the ![]() and
and ![]() parameters. The formal error bars are smaller than the symbol sizes. Bottom panel: the relative pulsation amplitude versus the relative mean flux in equidistant bins. Here the vertical error bars show the standard deviations of the mean, while the horizontal error bars indicate the width of the bins (note the missing bin at 0.7 due to lack of points). The diagonal black lines show the line of equality in both panels. See text for details.
parameters. The formal error bars are smaller than the symbol sizes. Bottom panel: the relative pulsation amplitude versus the relative mean flux in equidistant bins. Here the vertical error bars show the standard deviations of the mean, while the horizontal error bars indicate the width of the bins (note the missing bin at 0.7 due to lack of points). The diagonal black lines show the line of equality in both panels. See text for details.
Current usage metrics show cumulative count of Article Views (full-text article views including HTML views, PDF and ePub downloads, according to the available data) and Abstracts Views on Vision4Press platform.
Data correspond to usage on the plateform after 2015. The current usage metrics is available 48-96 hours after online publication and is updated daily on week days.
Initial download of the metrics may take a while.