Fig. 6
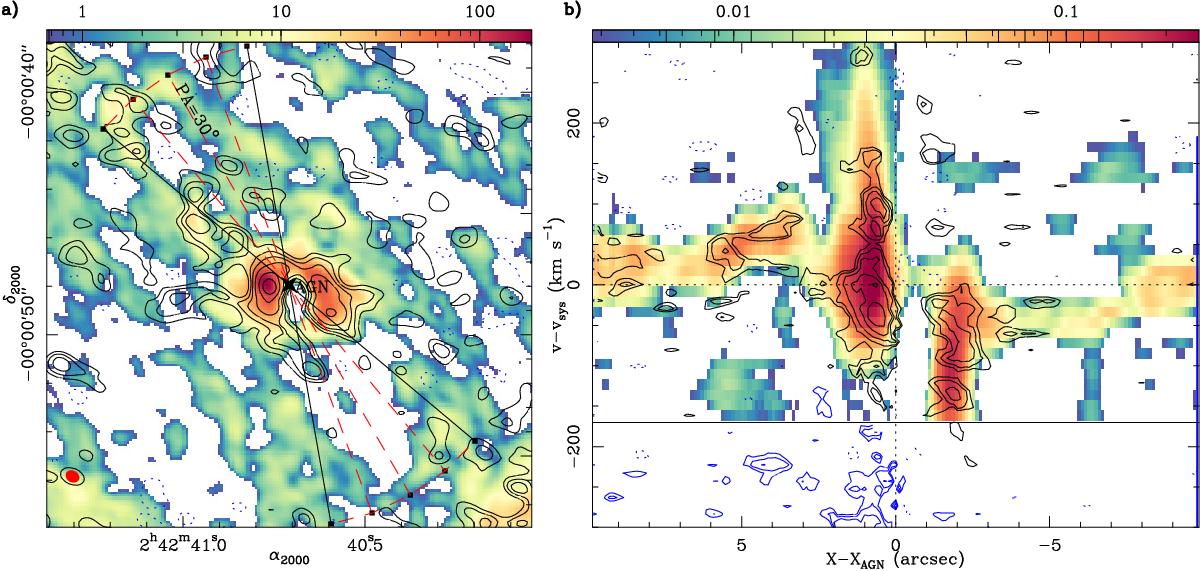
Panel a: overlay of the C2H(1–0) integrated intensity map (with contours as in Fig. 2) on the CO(3–2) integrated intensity map (with color scale expanding the range [3σ, 800σ], with 1σ = 0.22 Jy km s-1) of García-Burillo et al. (2014) in the central r = 10″ (700 pc) of NGC 1068. The (black) empty and (red) filled ellipses at the bottom left corner represent the C2H and CO beam sizes, respectively. Panel b: comparison of the average position-velocity (p−v) plot obtained for the outflow region in C2H(1–0) (black contours: −2.5σ (dashed contour), 2.5σ, 3.5σ, 5σ, to 9σ by 2σ, with 1σ = 0.18 mJy) and CO(3–2) (color scale: [2σ, 200σ], with 1σ = 1.3 mJy). The averaging has been done using the axes oriented along PA = 10°, 20°, 30°, 40°, and 50° (shown in a). The average outflow axis lies at PA = 30°. Blue contours represent the emission stemming from the secondary fine group of the C2H(1–0) multiplet (group-II). Offsets along the x-axis are measured in arc seconds relative to the AGN locus. Velocity scale is measured for the strongest C2H line at 87.317 GHz (rest frequency) and is relative to ![]() = 1136 km s-1. The black horizontal line indicates the edges of the CO(3–2) band.
= 1136 km s-1. The black horizontal line indicates the edges of the CO(3–2) band.
Current usage metrics show cumulative count of Article Views (full-text article views including HTML views, PDF and ePub downloads, according to the available data) and Abstracts Views on Vision4Press platform.
Data correspond to usage on the plateform after 2015. The current usage metrics is available 48-96 hours after online publication and is updated daily on week days.
Initial download of the metrics may take a while.