Fig. 4
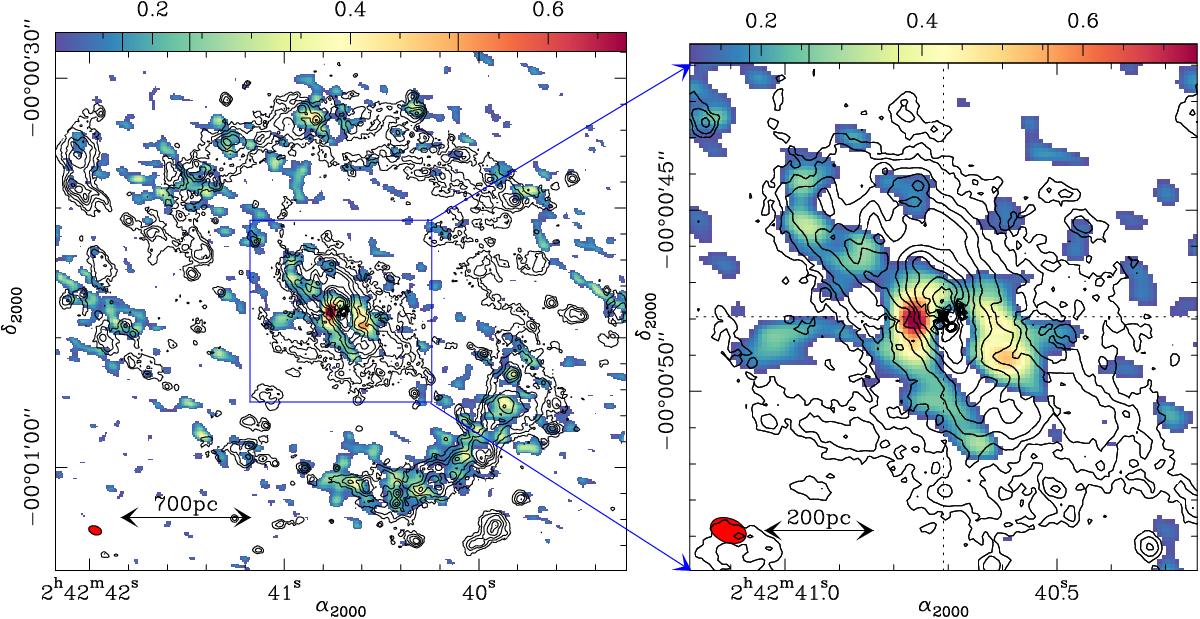
Left panel: overlay of the Paα emission HST map (contours) on the C2H(1–0) integrated intensity map (color scale as in Fig. 2). Contours of Paα emission are shown with logarithmic spacing from 2.4 to 1600 counts s-1 pixel-1 in steps of 0.28 dex. Right panel: same as left panel but zooming in on the outflow region. The position of the AGN is highlighted by the star marker. The (red) filled ellipses at the bottom left corners in both panels represent the C2H beam size.
Current usage metrics show cumulative count of Article Views (full-text article views including HTML views, PDF and ePub downloads, according to the available data) and Abstracts Views on Vision4Press platform.
Data correspond to usage on the plateform after 2015. The current usage metrics is available 48-96 hours after online publication and is updated daily on week days.
Initial download of the metrics may take a while.