Fig. 3
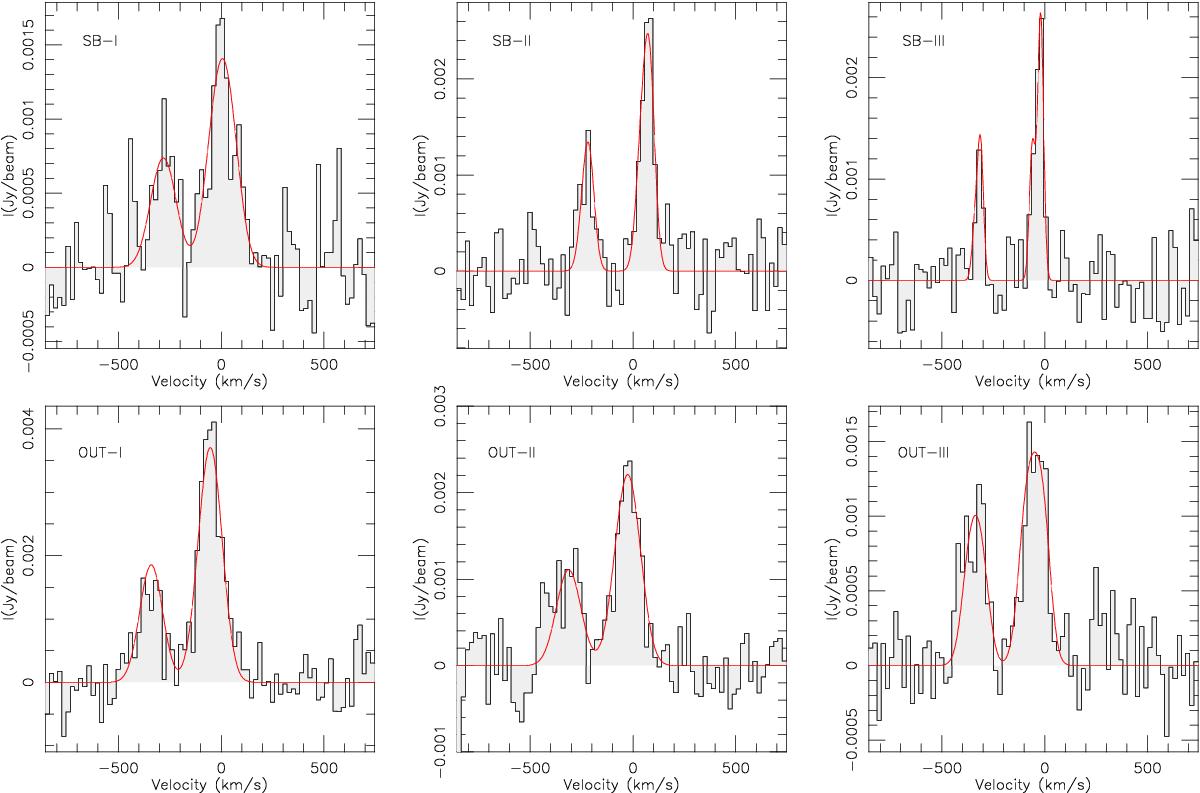
Upper panels: C2H emission spectra taken at three representative knots of the SB ring (SB-I, SB-II, and SB-III). Lower panels: C2H spectra taken at three representative knots of the outflow region (OUT-I, OUT-II, and OUT-III). The apertures used to extract the spectra correspond to the beam size at the location of each knot (![]() at PA = 69°). The positions of the knots are defined in Fig. 2. The velocity scale for each spectrum has been derived for the strongest C2H line at 87.317 GHz (rest frequency) and is relative to
at PA = 69°). The positions of the knots are defined in Fig. 2. The velocity scale for each spectrum has been derived for the strongest C2H line at 87.317 GHz (rest frequency) and is relative to ![]() = 1136 km s-1. The (red) curves show the composite Gaussian profiles of the best fit to the emission, as described is Sect. 3.3.
= 1136 km s-1. The (red) curves show the composite Gaussian profiles of the best fit to the emission, as described is Sect. 3.3.
Current usage metrics show cumulative count of Article Views (full-text article views including HTML views, PDF and ePub downloads, according to the available data) and Abstracts Views on Vision4Press platform.
Data correspond to usage on the plateform after 2015. The current usage metrics is available 48-96 hours after online publication and is updated daily on week days.
Initial download of the metrics may take a while.