Fig. 2
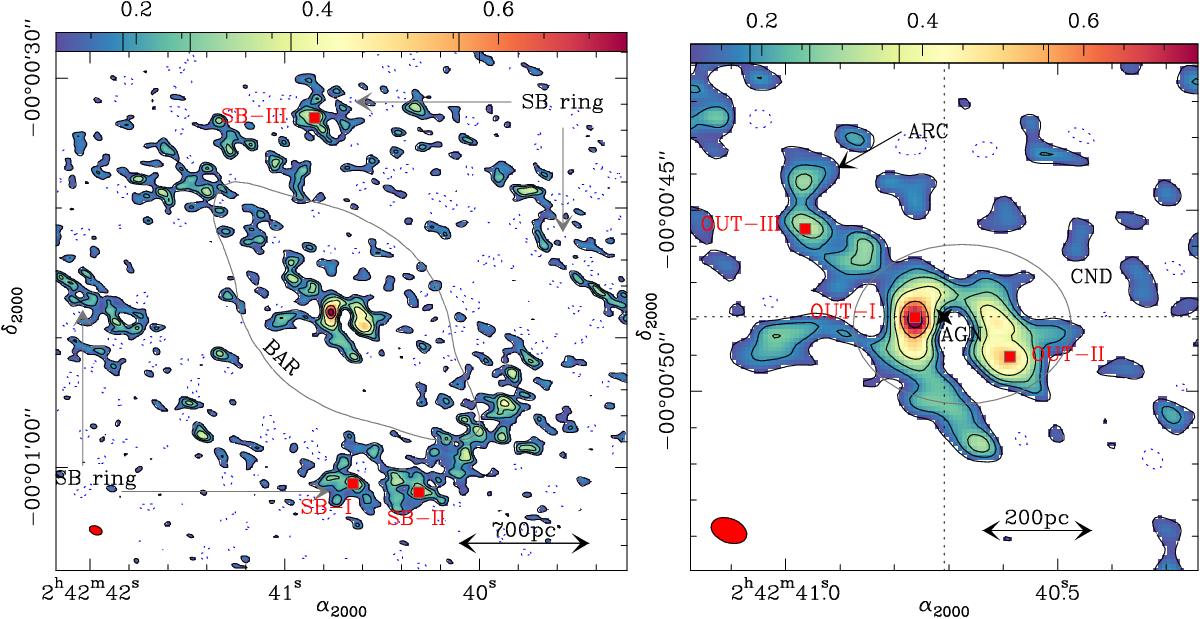
Left panel: C2H(1–0) integrated intensity map obtained with ALMA in the disk of NGC 1068. The map is shown in color scale with contour levels –3σ (dashed contour), 3σ, 5σ, 7σ, 10σ, 15σ, and 20σ, where 1σ = 0.037 Jy km s-1 beam-1. We identify the location of the SB ring and the bar. The latter is identified by a representative isophote of the NIR K-band image of 2MASS (Skrutskie et al. 2006). The (red) square markers highlight the positions of the knots SB-I, SB-II, and SB-III along the SB ring. Right panel: same as left panel but zooming in on the outflow region, which extends out to r ≃ 6″ (400 pc), as described by García-Burillo et al. (2014). The outflow region comprises the CND and the bow-shock arc. The position of the AGN (α2000 = 02h42m40.71s, δ2000 = −00°00′47.94″) is highlighted by the star marker. The (red) square markers highlight the positions of the knots OUT-I, OUT-II, and OUT-III. The (red) filled ellipses at the bottom left corners in both panels represent the C2H beam size (![]() at PA = 69°).
at PA = 69°).
Current usage metrics show cumulative count of Article Views (full-text article views including HTML views, PDF and ePub downloads, according to the available data) and Abstracts Views on Vision4Press platform.
Data correspond to usage on the plateform after 2015. The current usage metrics is available 48-96 hours after online publication and is updated daily on week days.
Initial download of the metrics may take a while.