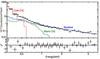
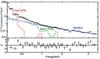
Fig. 6

Best-fits of the spectrum of the extended emission using a collisionally ionized plasma model (left panel) and a photoionized plasma model (right panel). In each panel, we show the total best-fit model (solid line), the spectral components separately (dotted lines), and the residuals in terms of χ2. The spectral components are labeled as in Table 4.
Current usage metrics show cumulative count of Article Views (full-text article views including HTML views, PDF and ePub downloads, according to the available data) and Abstracts Views on Vision4Press platform.
Data correspond to usage on the plateform after 2015. The current usage metrics is available 48-96 hours after online publication and is updated daily on week days.
Initial download of the metrics may take a while.