Fig. 3
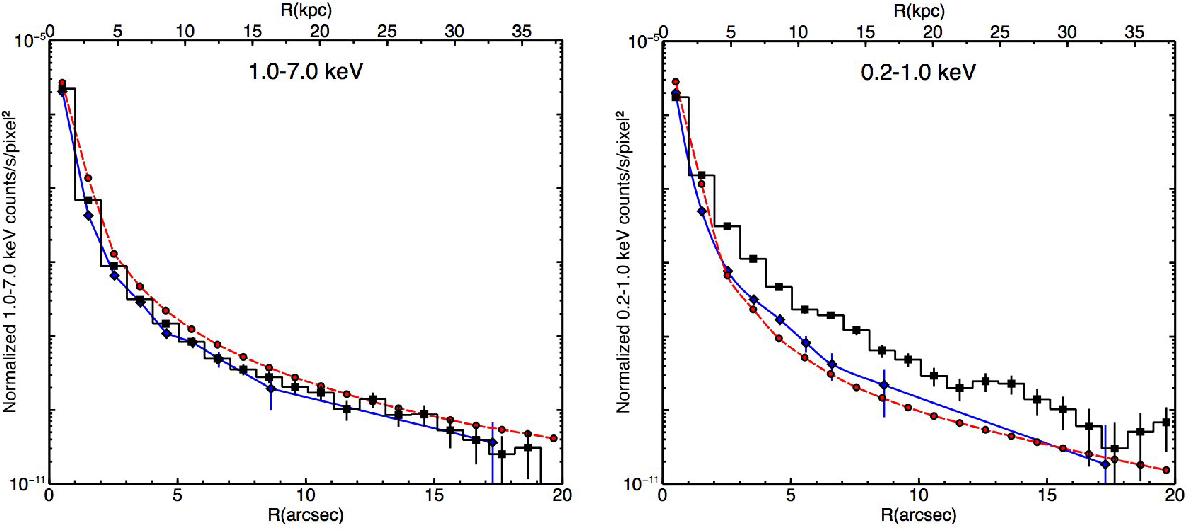
Comparison among the surface-brightness profiles of 1H 0419-577 (histogram, filled squares), those of PKS 2126-158 (solid line, filled diamonds), and those of the Chandra PSF (dashed line, filled circles). We show the comparison in the 1.0–7.0 keV (left panel) and in the 0.2–1.0 keV (right panel) energy bands. All the profiles are background subtracted and normalized to one. We note the logarithmic scale on the vertical axes.
Current usage metrics show cumulative count of Article Views (full-text article views including HTML views, PDF and ePub downloads, according to the available data) and Abstracts Views on Vision4Press platform.
Data correspond to usage on the plateform after 2015. The current usage metrics is available 48-96 hours after online publication and is updated daily on week days.
Initial download of the metrics may take a while.