Fig. 4
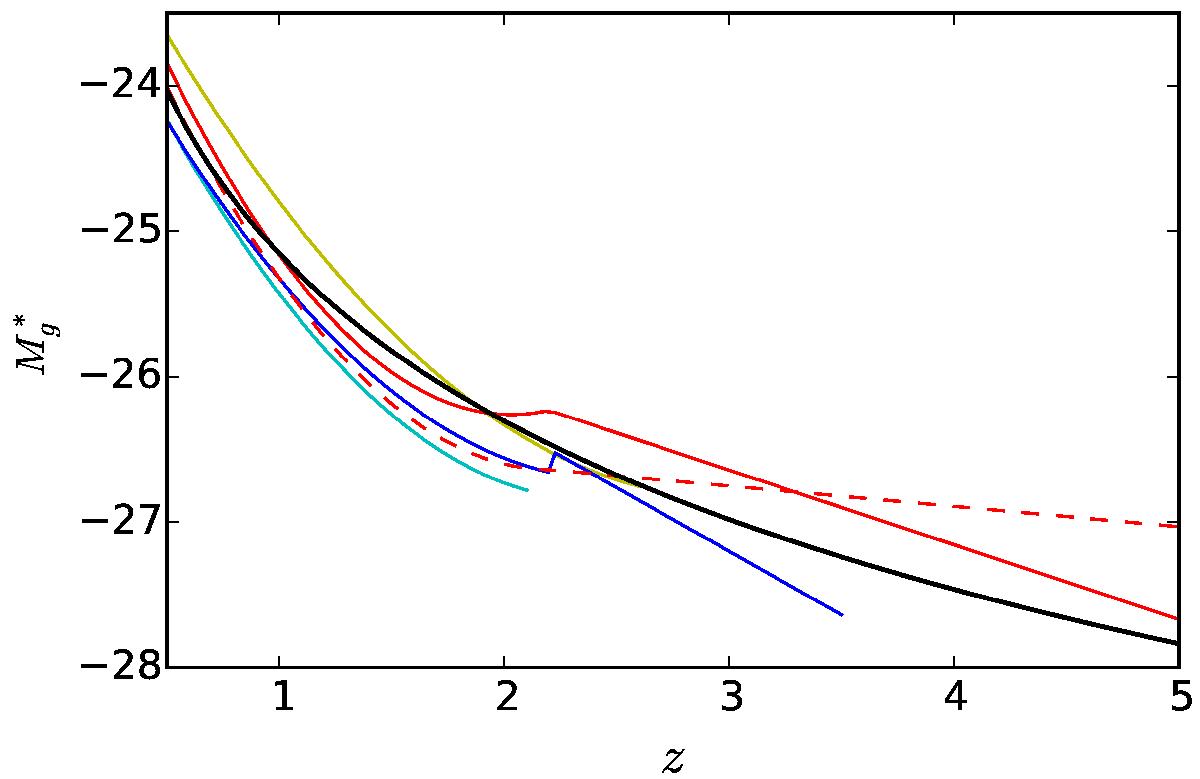
Evolution of DPL break magnitude, ![]() , with redshift for various model luminosity functions. The solid red curve is the best-fit PLE+LEDE model from this paper. The dashed curve is the PLE+LEDE fit from Palanque-Delabrouille et al. (2016). The thicker black curve is the best-fit PLE+LEDE2 model from this paper. The cyan, yellow, and blue curves are from Richards et al. (2005), Croom et al. (2009), and Ross et al. (2013), respectively.
, with redshift for various model luminosity functions. The solid red curve is the best-fit PLE+LEDE model from this paper. The dashed curve is the PLE+LEDE fit from Palanque-Delabrouille et al. (2016). The thicker black curve is the best-fit PLE+LEDE2 model from this paper. The cyan, yellow, and blue curves are from Richards et al. (2005), Croom et al. (2009), and Ross et al. (2013), respectively.
Current usage metrics show cumulative count of Article Views (full-text article views including HTML views, PDF and ePub downloads, according to the available data) and Abstracts Views on Vision4Press platform.
Data correspond to usage on the plateform after 2015. The current usage metrics is available 48-96 hours after online publication and is updated daily on week days.
Initial download of the metrics may take a while.