Fig. 9
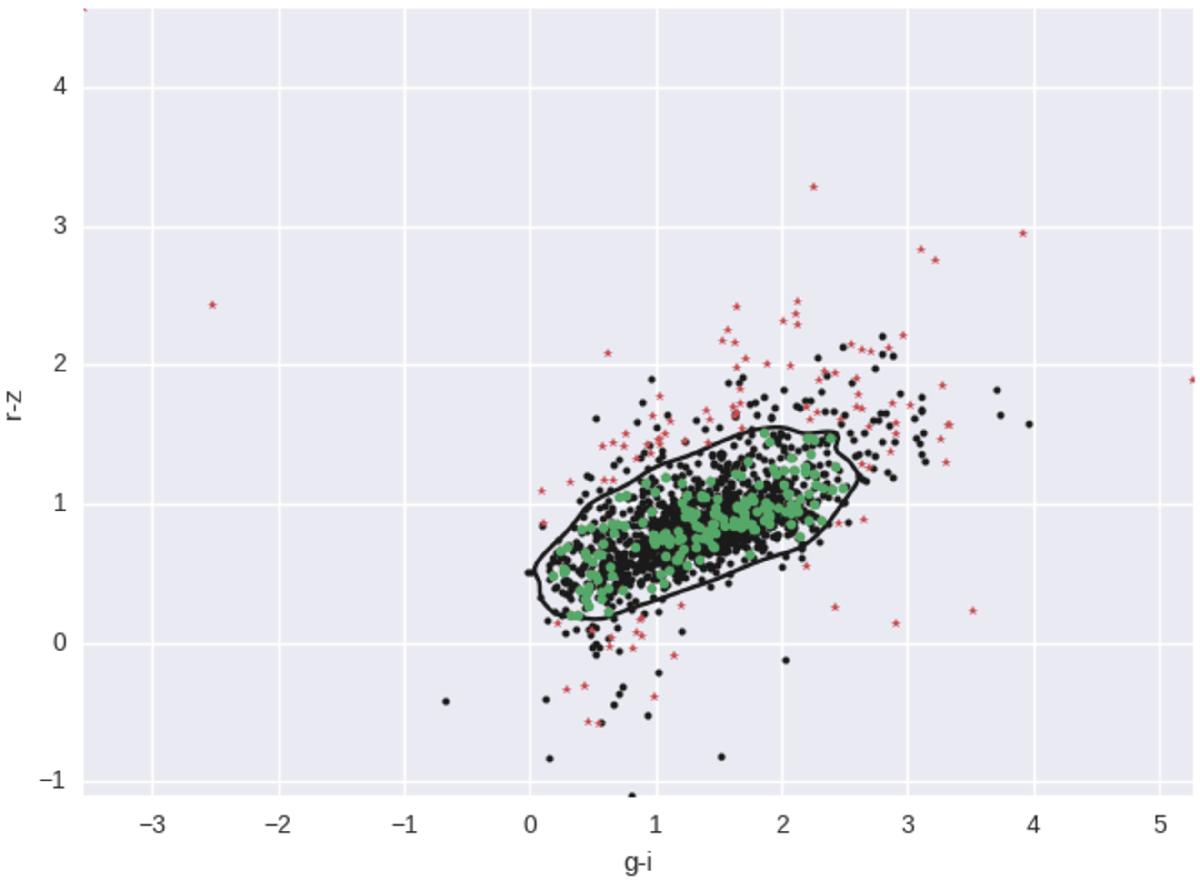
i−z vs. g−i colour space diagram. Black dots present the sources in our training sample. The black solid line defines the region of the colour space that contains 90% of the training sources as estimated by the KDE test. Green dots are the sources from the X-ATLAS sample inside the 90% region, and red crosses present the remaining X-ATLAS sources.
Current usage metrics show cumulative count of Article Views (full-text article views including HTML views, PDF and ePub downloads, according to the available data) and Abstracts Views on Vision4Press platform.
Data correspond to usage on the plateform after 2015. The current usage metrics is available 48-96 hours after online publication and is updated daily on week days.
Initial download of the metrics may take a while.