Fig. 5
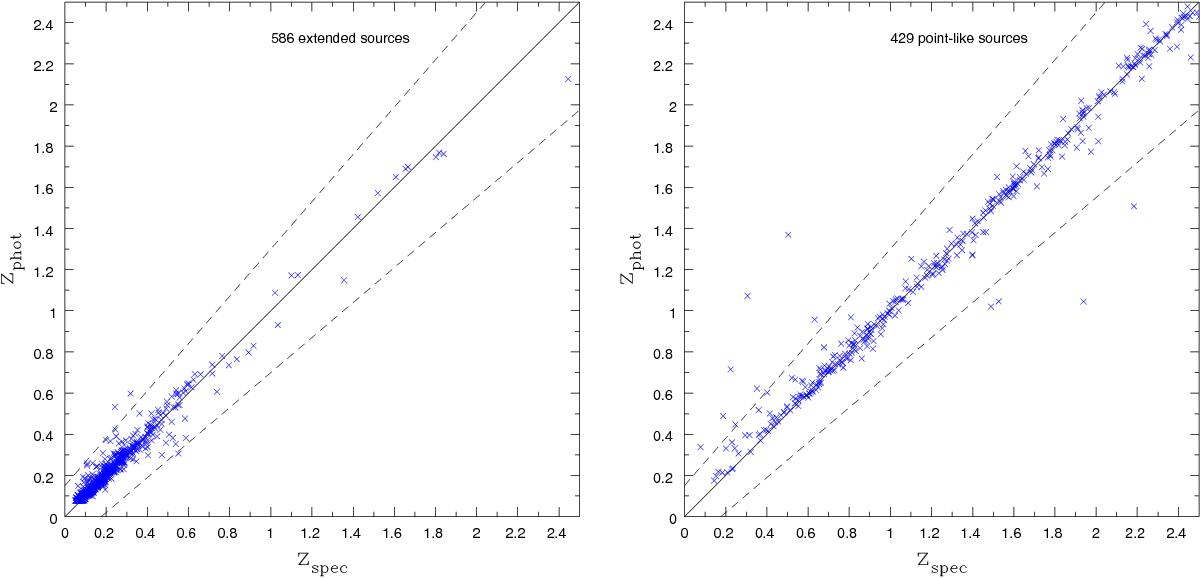
Performance of TPZ using the ten available photometric bands (SDSS+WISE+near-IR). The training sample has been split into train and test files to compare the estimated photometric redshifts with the spectroscopic redshifts of the sources. The dashed lines correspond to Δznorm = ± 0.15. Based on our analysis, the number of outliers is η = 9% and η = 13%, for the extended and point-like sources, respectively. The normalized absolute median deviation is σnmad ≈ 0.04–0.05.
Current usage metrics show cumulative count of Article Views (full-text article views including HTML views, PDF and ePub downloads, according to the available data) and Abstracts Views on Vision4Press platform.
Data correspond to usage on the plateform after 2015. The current usage metrics is available 48-96 hours after online publication and is updated daily on week days.
Initial download of the metrics may take a while.