Free Access
Fig. 1
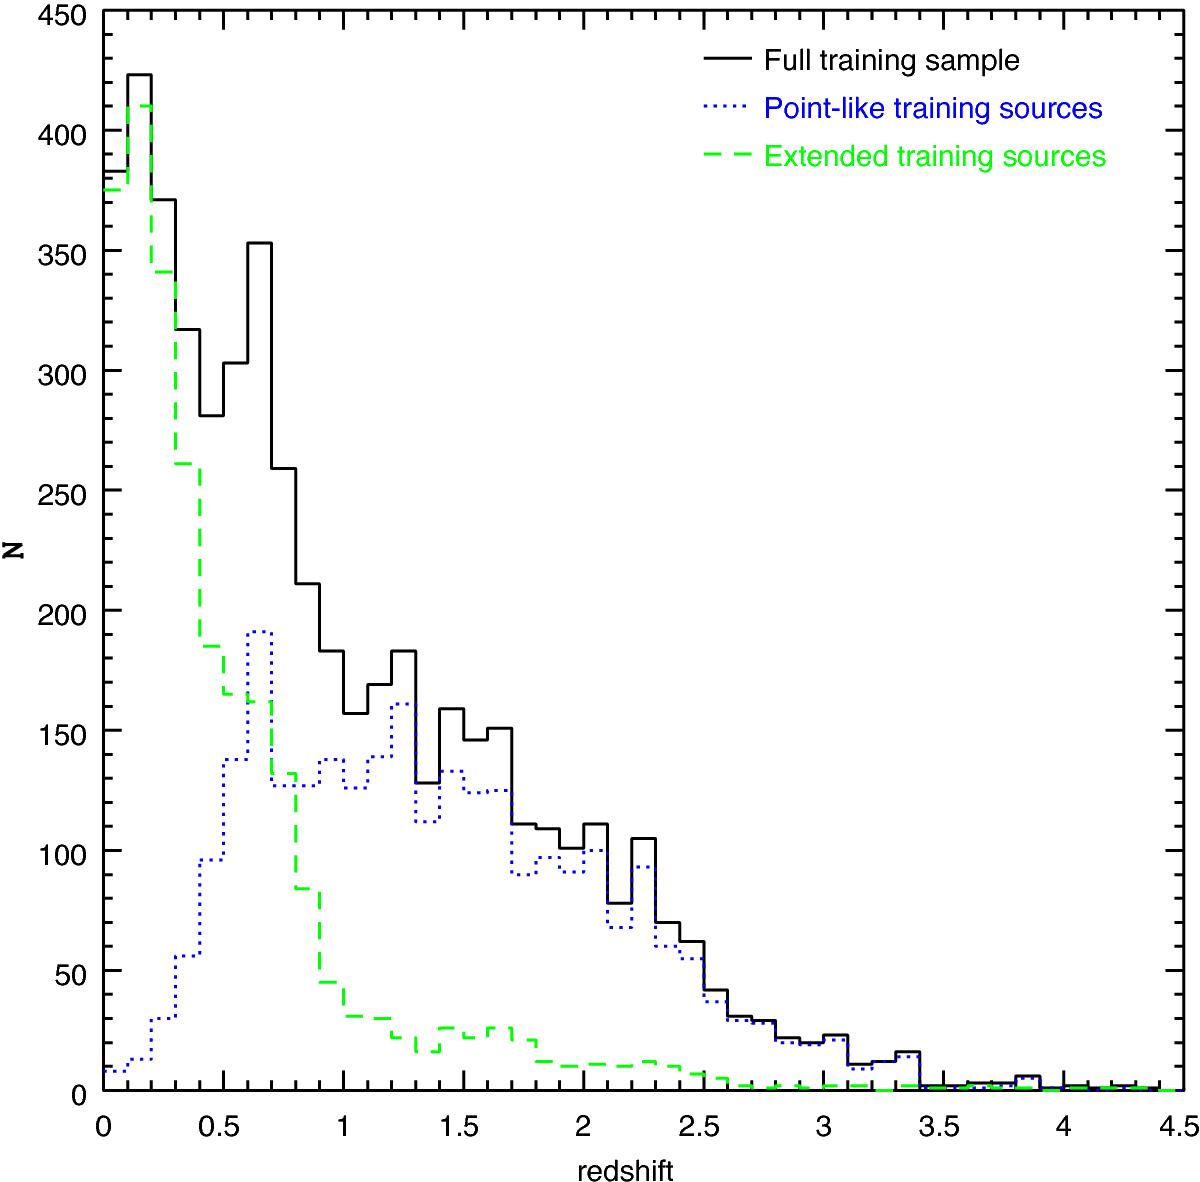
Redshift distribution of the 5157 sources used to train the TPZ algorithm (black solid line). The dashed and dotted lines present the redshift distribution when we split the training sources into extended and point like based on their optical classification.
Current usage metrics show cumulative count of Article Views (full-text article views including HTML views, PDF and ePub downloads, according to the available data) and Abstracts Views on Vision4Press platform.
Data correspond to usage on the plateform after 2015. The current usage metrics is available 48-96 hours after online publication and is updated daily on week days.
Initial download of the metrics may take a while.