Fig. 2
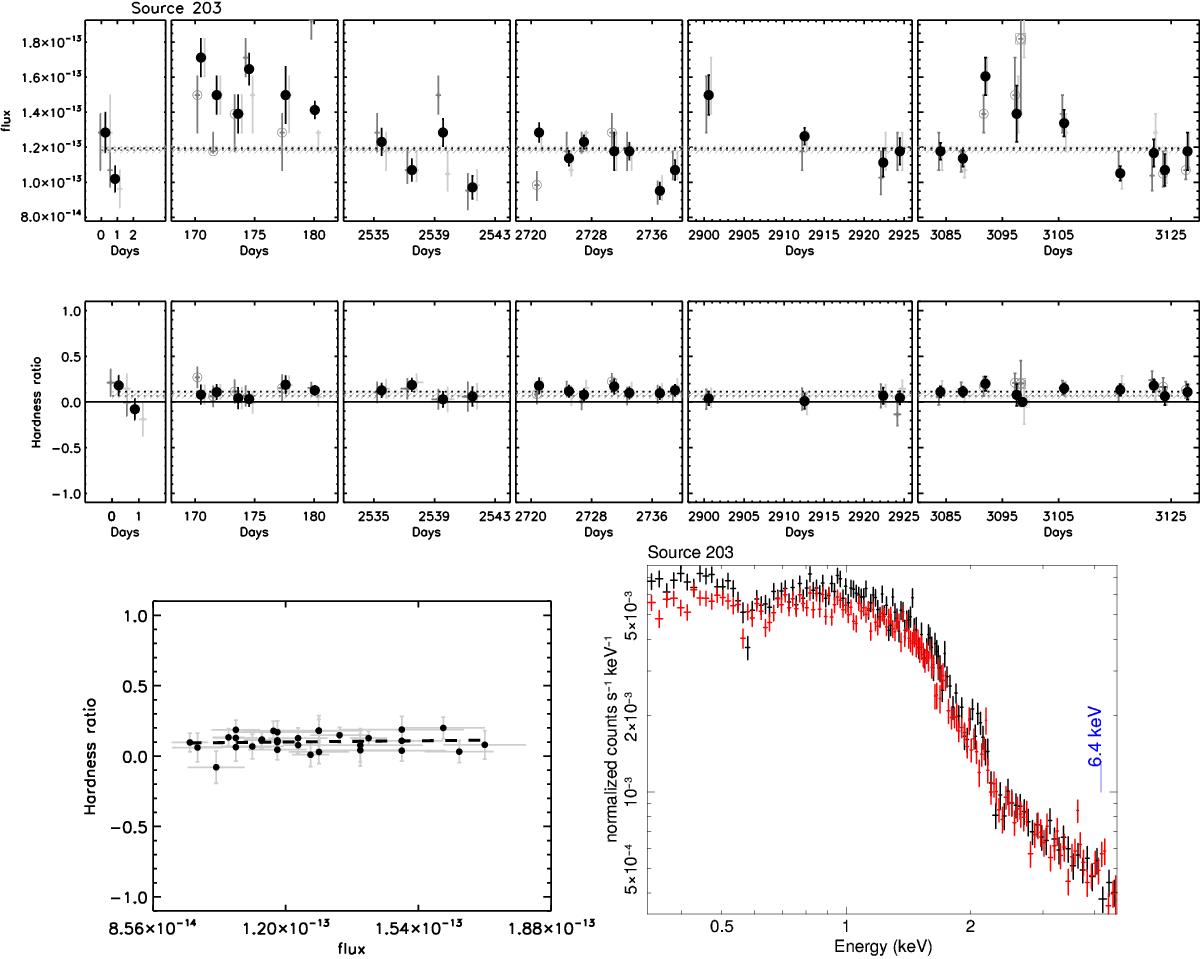
First and second rows: lightcurves in fluxes and HR. The fluxes are computed in the 0.5 and 8 keV observed frame band averaged between MOS1 and MOS2 at each of the 33 observations following the procedure of Park et al. (2006). Black solid dots represent the weighted average of the two MOS detectors, where we only use epochs without any potential problem in the photometry. Observations with potential photometry problems (e.g. where either more than 10% of the source area falls outside one of the MOS chips or on an intra-chip gap, or where the source and background regions fall on different chips) are represented by an empty circle; similarly observations where more than 30% of the background area falls outside one of the MOS chips or on an intra-chip gap, are represented by an empty square. These epochs have been represented in grey. The horizontal error bars represent the duration of the observation. The flux averaged over all epochs and both MOS1 and MOS2 detectors is shown as a dotted black line. Only epochs without any potential problem in photometry are used to compute the averages shown in the plot and used for the spectral analysis described in the text. The black solid line marks the zero level in all panels. The average of the MOS fluxes and HRs (over the epochs without any potential problem in the photometry) is represented as a dotted black line and its error is represented by dashed grey lines. Third row, left: HR versus flux of the individual observations. The dashed line is the linear regression line (calculated not considering the errors). Third row, right: high-flux-state and low-flux-state spectra represented with black and red data points respectively.
Current usage metrics show cumulative count of Article Views (full-text article views including HTML views, PDF and ePub downloads, according to the available data) and Abstracts Views on Vision4Press platform.
Data correspond to usage on the plateform after 2015. The current usage metrics is available 48-96 hours after online publication and is updated daily on week days.
Initial download of the metrics may take a while.