Fig. 1
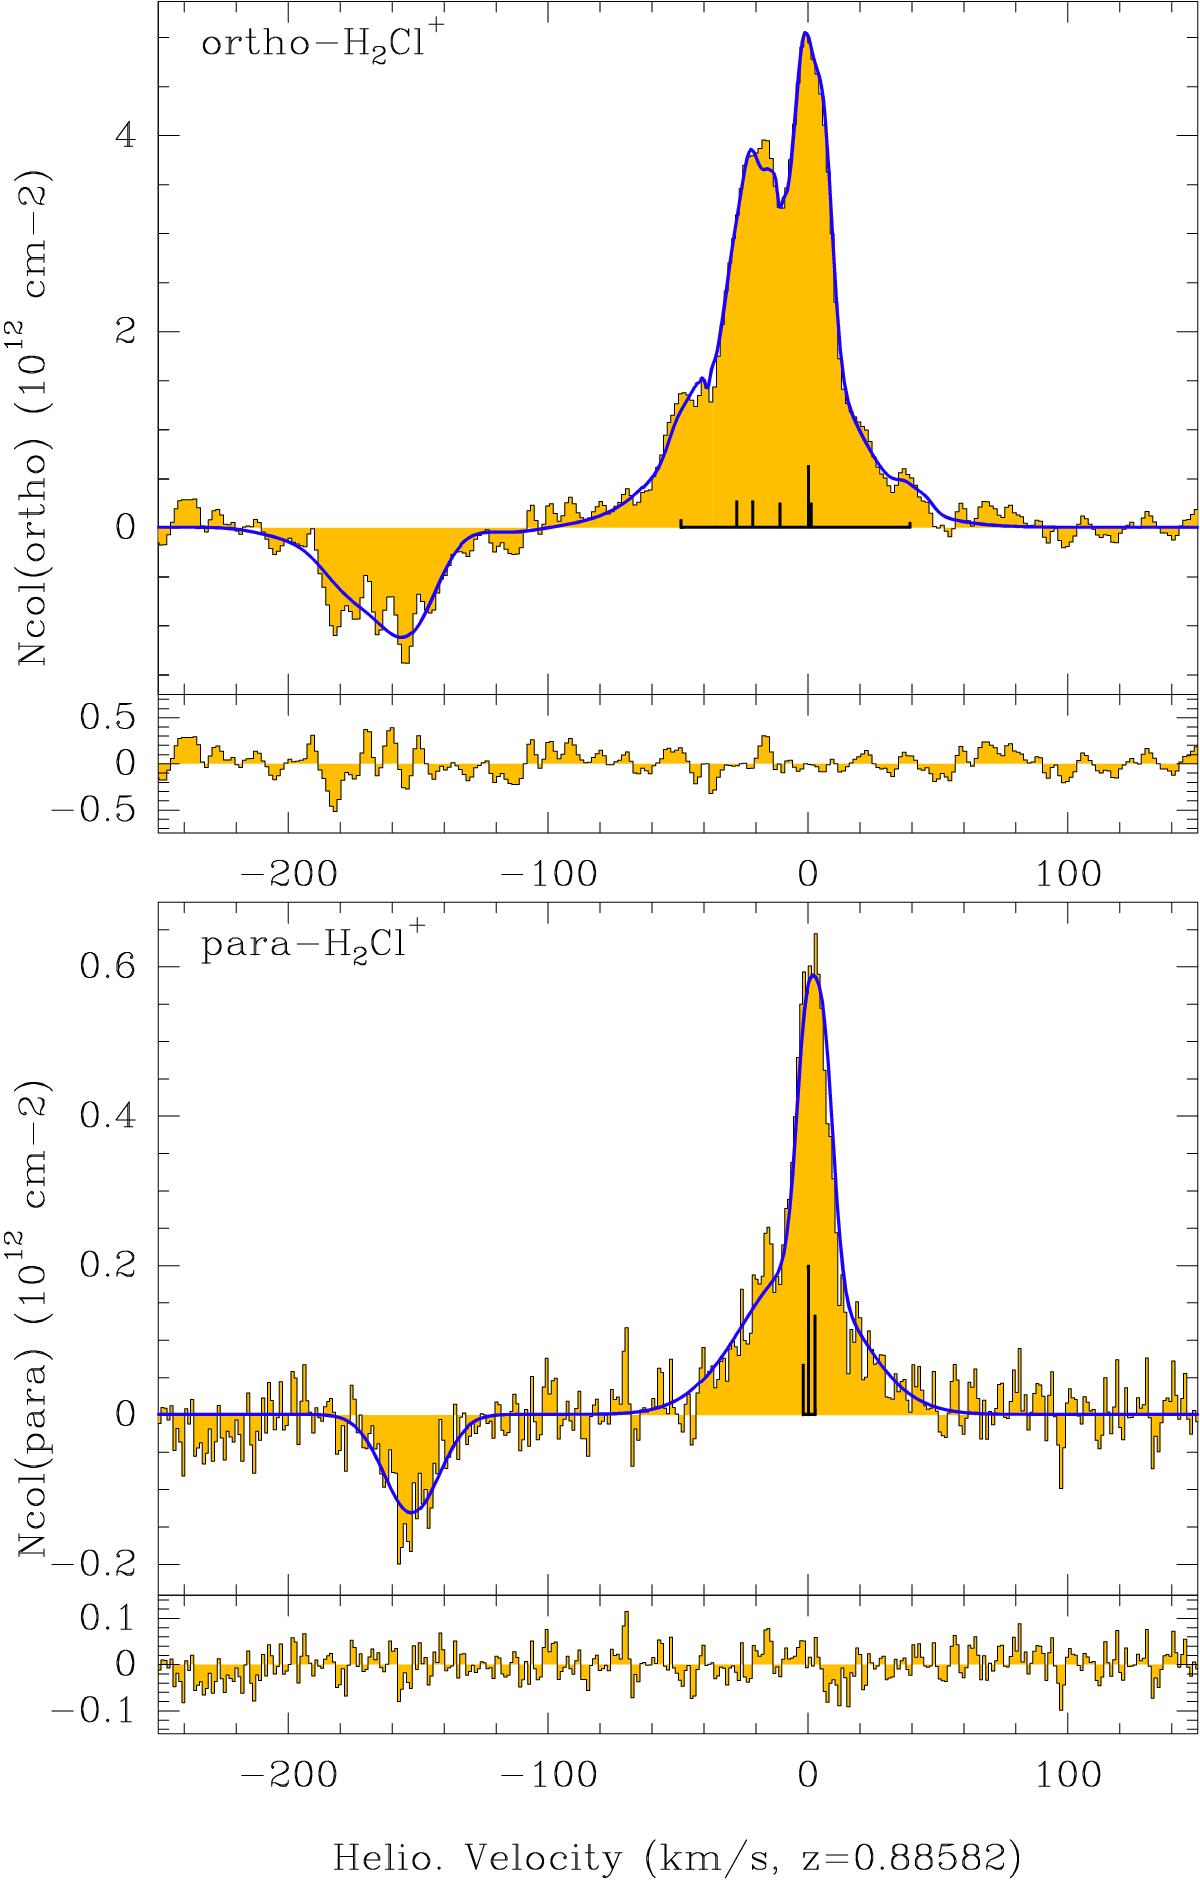
Spectra of the ortho (upper panel) and para (lower panel) forms of H2Cl+ toward PKS 1830−211. The y-axis is in unit of column density.The opacities were converted into column densities assuming that the excitation is locked to the temperature of the CMB. The spectra of the SW line of sight have been divided by that of the NE. The SW absorption appears as positive feature near v = 0 km s-1, while the NE absorption appears as the negative feature near v = −150 km s-1. The fit with five Gaussian velocity components, including both ortho and para forms, is shown in blue on top of the spectras, and the corresponding residuals are shown in the lower boxes. The velocity scale is set for the strongest hyperfine component. The hyperfine structure is plotted at the base of each spectrum.
Current usage metrics show cumulative count of Article Views (full-text article views including HTML views, PDF and ePub downloads, according to the available data) and Abstracts Views on Vision4Press platform.
Data correspond to usage on the plateform after 2015. The current usage metrics is available 48-96 hours after online publication and is updated daily on week days.
Initial download of the metrics may take a while.