Free Access
Fig. 4
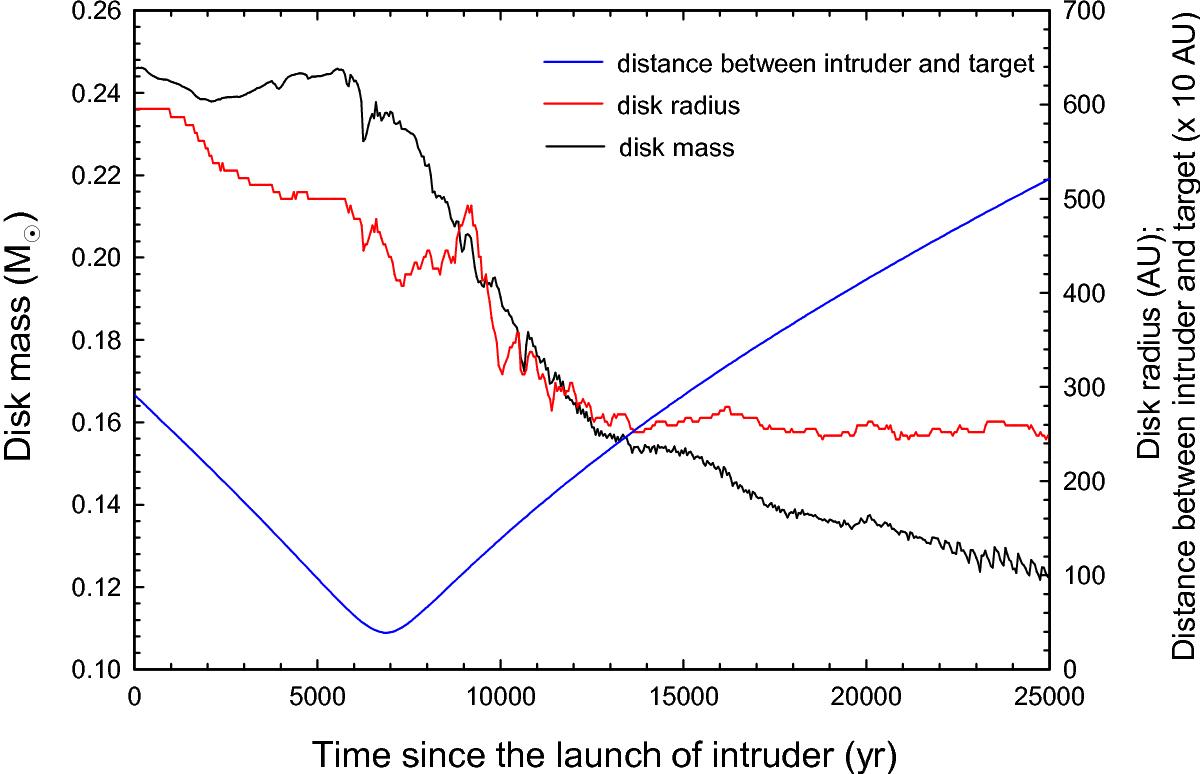
Variations in the disk mass and radius (the black and red lines) as a function of time elapsed since the launch of the intruder star. The blue line shows the distance of the intruder from the target star.
Current usage metrics show cumulative count of Article Views (full-text article views including HTML views, PDF and ePub downloads, according to the available data) and Abstracts Views on Vision4Press platform.
Data correspond to usage on the plateform after 2015. The current usage metrics is available 48-96 hours after online publication and is updated daily on week days.
Initial download of the metrics may take a while.