Fig. 6
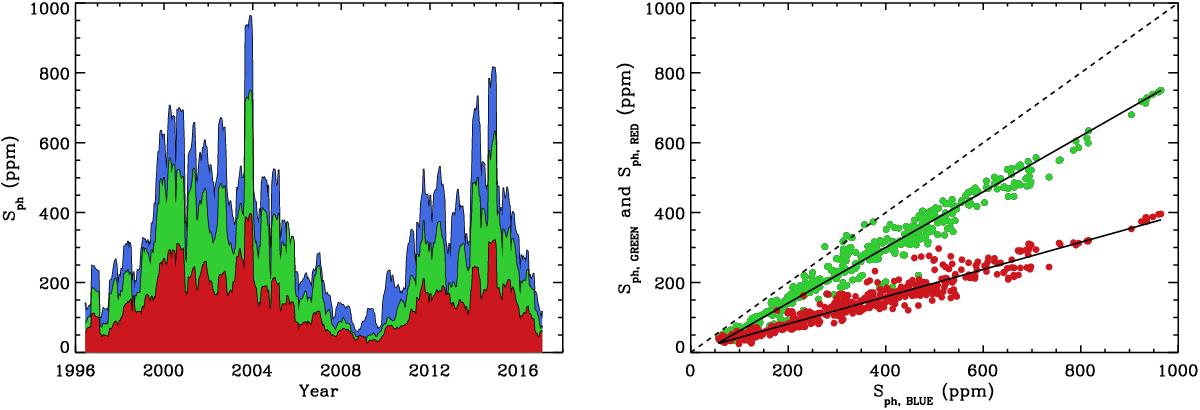
Left panel: photospheric activity proxies, Sph (in ppm), for each of the BLUE, GREEN, and RED channels of the VIRGO/SPM observations as a function of time. Right panel: photospheric activity proxy, Sph from the VIRGO/SPM GREEN (GREEN dots) and RED (red dots) channels as a function of the photospheric index, Sph, from the BLUE channel. The solid lines correspond to weighted linear regressions between the data, and the dashed line represents the 1:1 correlation.
Current usage metrics show cumulative count of Article Views (full-text article views including HTML views, PDF and ePub downloads, according to the available data) and Abstracts Views on Vision4Press platform.
Data correspond to usage on the plateform after 2015. The current usage metrics is available 48-96 hours after online publication and is updated daily on week days.
Initial download of the metrics may take a while.