Fig. 3
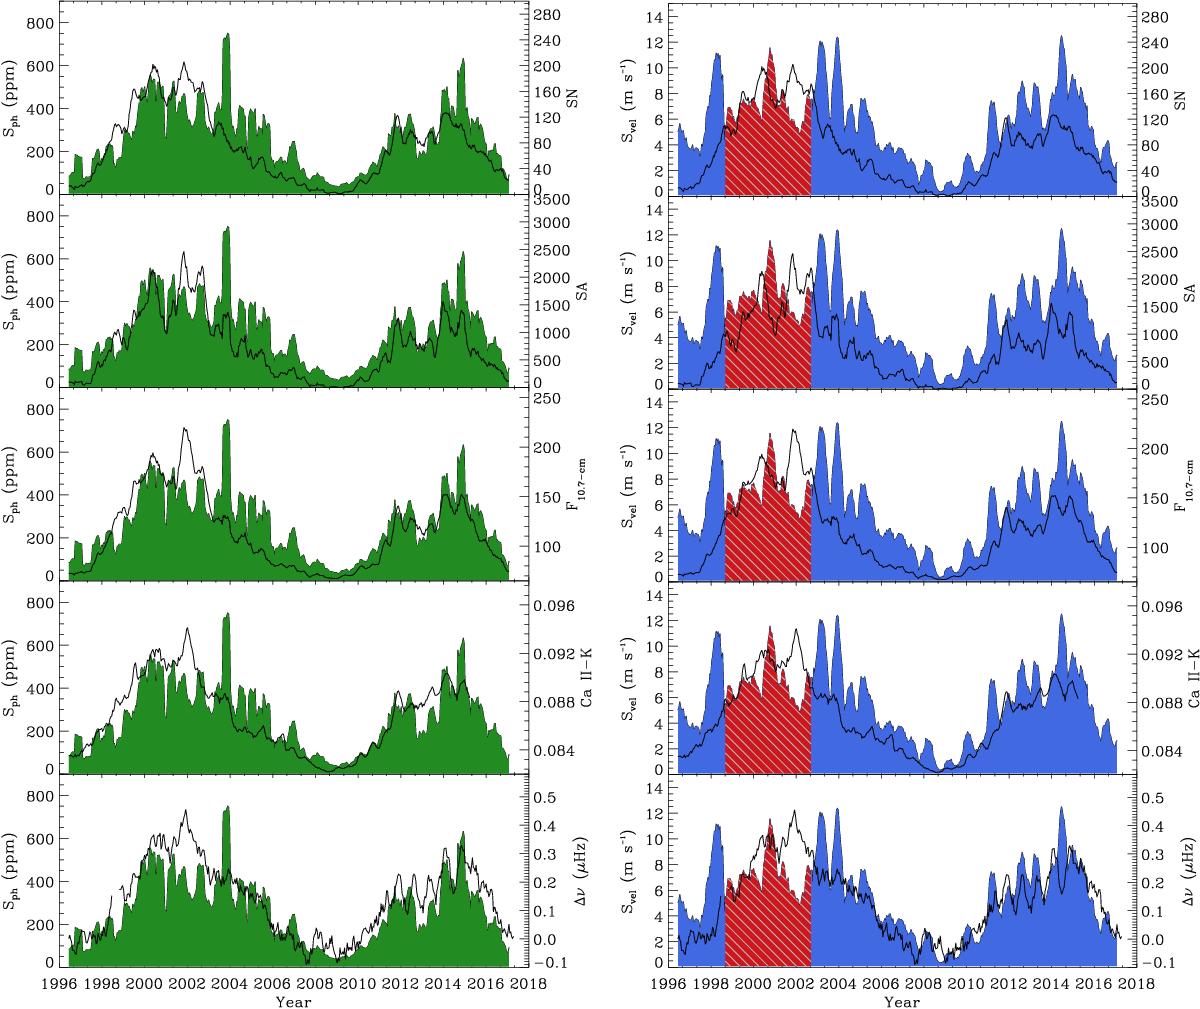
Magnetic activity proxies Sph,GREEN (in ppm) and Svel (in m s-1) measured from the photometric VIRGO/SPM GREEN channel (GREEN filled, left panels) and the radial velocity GOLF (BLUE filled, right panels) observations as a function of time and compared to standard indices of solar activity (solid black lines). From top to bottom, the total sunspot number (SN), total sunspot area (SA), 10.7-cm radio flux (F10.7-cm) in 10-22 s-1 m-2 Hz-1, Ca ii K-line line emission index in Å, and mean frequency shifts of the l = 0,1 and 2 acoustic oscillations (Δν) in μHz are shown. The red shaded areas in the right-hand panels represent the period when GOLF was observing in the red wing of the sodium line.
Current usage metrics show cumulative count of Article Views (full-text article views including HTML views, PDF and ePub downloads, according to the available data) and Abstracts Views on Vision4Press platform.
Data correspond to usage on the plateform after 2015. The current usage metrics is available 48-96 hours after online publication and is updated daily on week days.
Initial download of the metrics may take a while.