Fig. 8
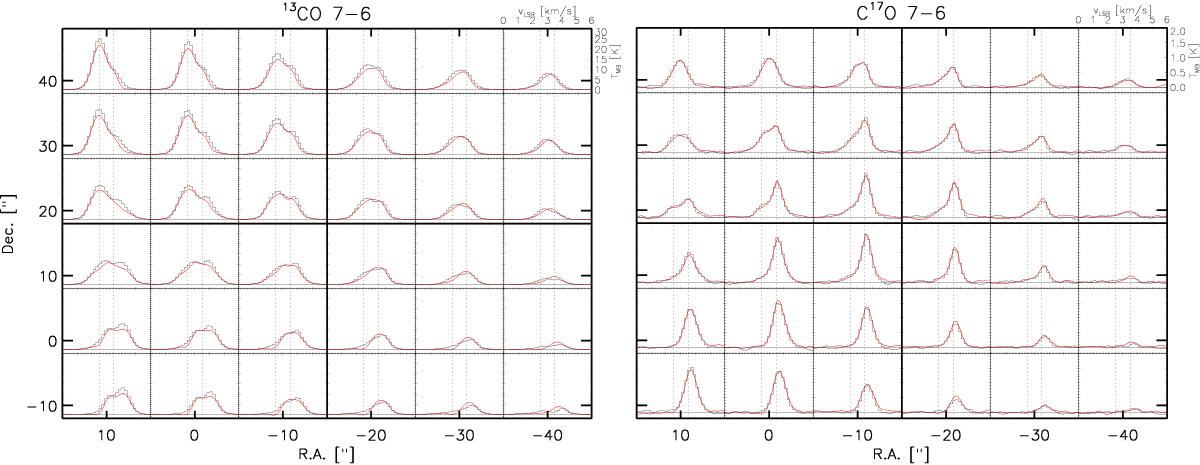
Oversampled maps in 13CO (7–6) (left) and C17O (7–6) (right) with the 27′′ beam of Herschel. The υLSR and Tmb scales are indicated in the upper right corners. The dashed vertical lines, at LSR velocities of 2.5 km s-1 and 3.5 km s-1, respectively, identify two radial velocity components of the fitted Gaussians, shown by the smooth red curves, whereas the observations are shown as histograms.
Current usage metrics show cumulative count of Article Views (full-text article views including HTML views, PDF and ePub downloads, according to the available data) and Abstracts Views on Vision4Press platform.
Data correspond to usage on the plateform after 2015. The current usage metrics is available 48-96 hours after online publication and is updated daily on week days.
Initial download of the metrics may take a while.