Fig. 4
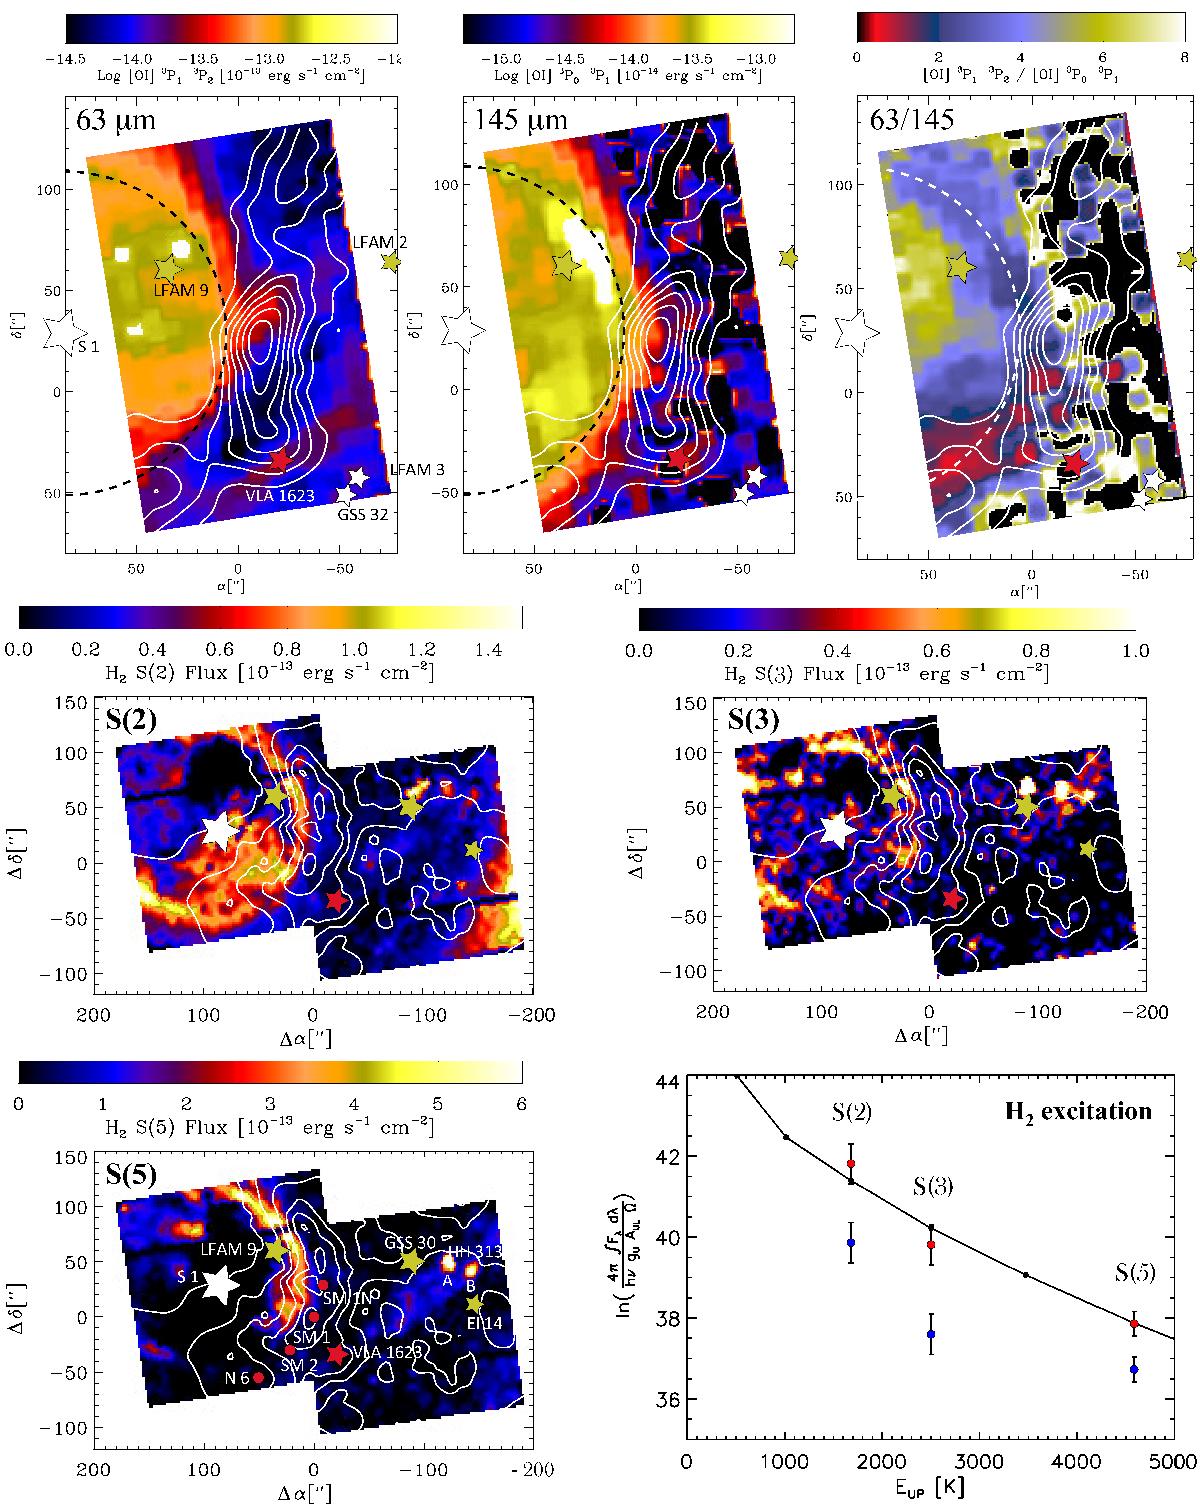
Upper panels: (from left to right) Distribution of the emission in [O i] 63 μm, [O i] 145 μm, and the ratio of their intensities I([O i] 63 μm)/I([O i] 145 μm). The illuminating source, S 1, is depicted as a white star on the left side of the frames, being at the centre of the dashed circles. The white contours outline integrated N2H+ (3–2) emission. Lower panels: distribution of the S(2), S(3), and S(5) pure rotational lines of H2 are shown by the coloured maps, with the fluxes given by the scale bars. These data were obtained with the ISOCAM-CVF. The white contours and the symbols are as in Fig. 1. The graph shows the fit with the Meudon PDR code (Le Petit et al. 2006, red dots) to the dereddened observations for AV = 6 mag. Blue data points are the observed values. Other H2 lines, i.e. S(1) and S(4), are also filled in and shown as black dots.
Current usage metrics show cumulative count of Article Views (full-text article views including HTML views, PDF and ePub downloads, according to the available data) and Abstracts Views on Vision4Press platform.
Data correspond to usage on the plateform after 2015. The current usage metrics is available 48-96 hours after online publication and is updated daily on week days.
Initial download of the metrics may take a while.