Fig. 2
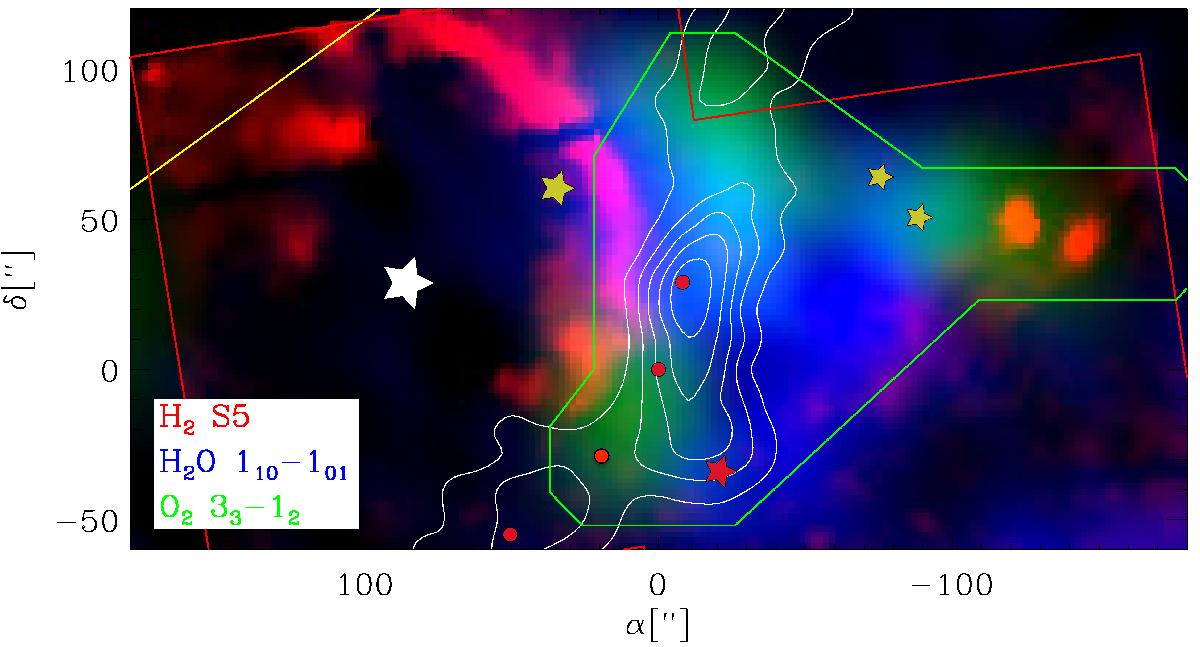
Observed layers of the edge-on PDR in ρ Oph A. From left to right: H2 6.9 μm, O2 487 GHz, and H2O 557 GHz are shown in red, green, and blue, respectively. Symbols are as in Fig. 1 and the region of H2 observations is shown by the partial red polygon. The H2 sources near (–100, 50) are gas shocked by HH-flows (see also Liseau & Justtanont 2009), and faint H2 emission can also be seen from the VLA 1623 outflow. The white contours outline the integrated N2H+ (3–2) emission, indicating the presence of dense gas above 106 cm-3 (Liseau et al. 2015, Paper I).
Current usage metrics show cumulative count of Article Views (full-text article views including HTML views, PDF and ePub downloads, according to the available data) and Abstracts Views on Vision4Press platform.
Data correspond to usage on the plateform after 2015. The current usage metrics is available 48-96 hours after online publication and is updated daily on week days.
Initial download of the metrics may take a while.