Fig. A.1
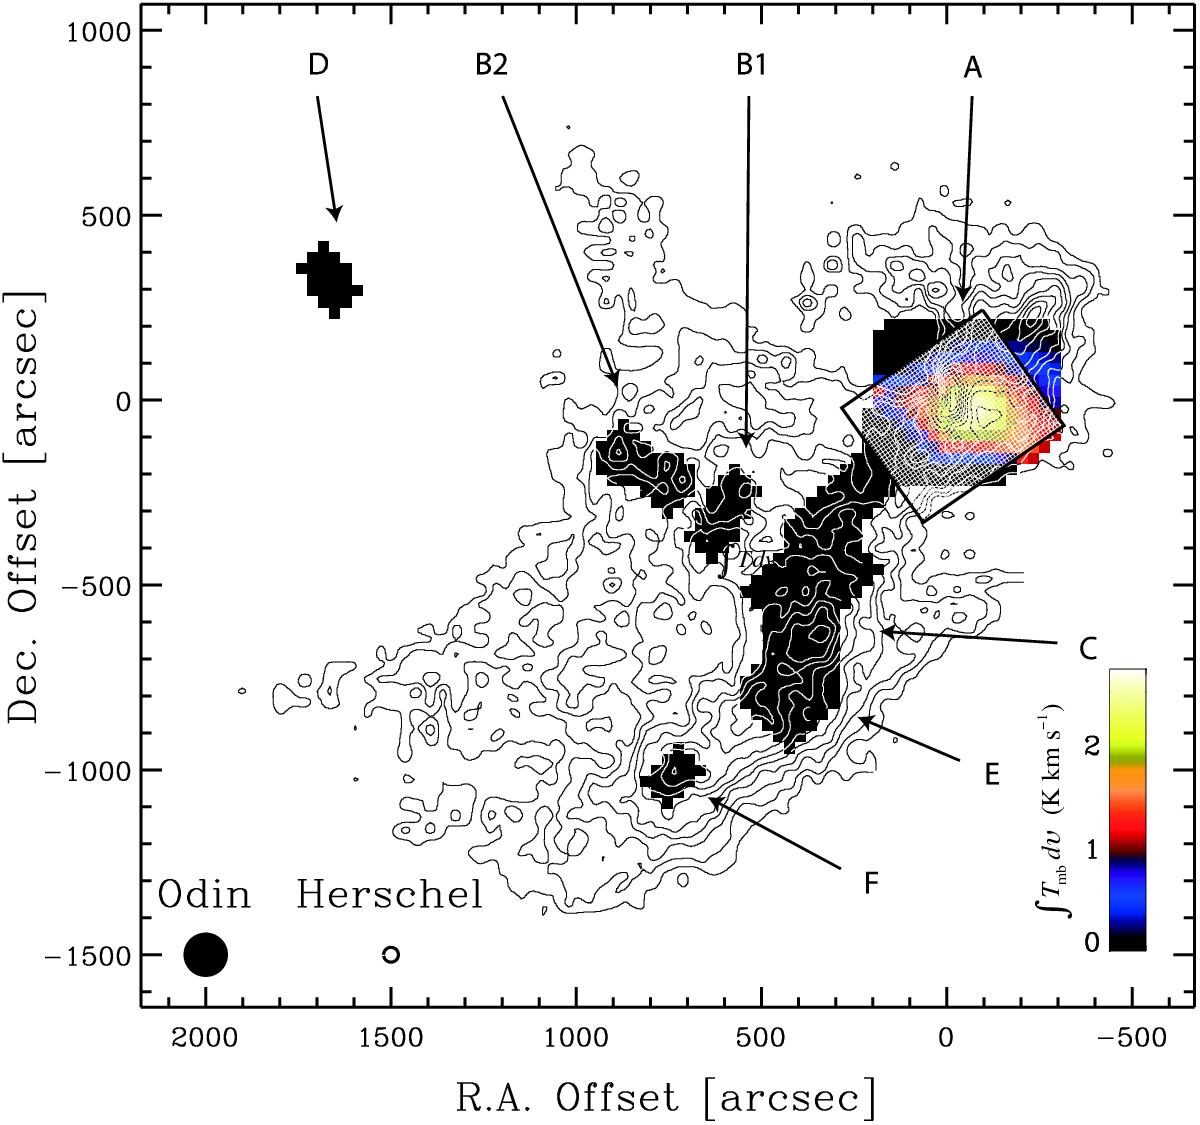
Spectral line image of the ρ Oph cloud (L 1688) in the H2O (110−101) 557 GHz line obtained by Odin with its 2′ beam, which is indicated to scale in the lower left corner. The colour-coding for the integrated intensity ![]() is shown by the scale bar in the lower right. The cores A through F are labelled, and the Odin data are superposed onto the contours of integrated C18O(J = 1–0) emission from Umemoto et al. (2002). The J2000-coordinates of the (0, 0) position are RA = 16h26m24
is shown by the scale bar in the lower right. The cores A through F are labelled, and the Odin data are superposed onto the contours of integrated C18O(J = 1–0) emission from Umemoto et al. (2002). The J2000-coordinates of the (0, 0) position are RA = 16h26m24![]() 6 and Dec = −24°23′54′′ and offsets are in seconds of arc. The Herschel beam at 557 GHz is shown next to that of Odin and the inclined, semi-transparent rectangle outlines the region mapped with HIFI.
6 and Dec = −24°23′54′′ and offsets are in seconds of arc. The Herschel beam at 557 GHz is shown next to that of Odin and the inclined, semi-transparent rectangle outlines the region mapped with HIFI.
Current usage metrics show cumulative count of Article Views (full-text article views including HTML views, PDF and ePub downloads, according to the available data) and Abstracts Views on Vision4Press platform.
Data correspond to usage on the plateform after 2015. The current usage metrics is available 48-96 hours after online publication and is updated daily on week days.
Initial download of the metrics may take a while.