Fig. 13
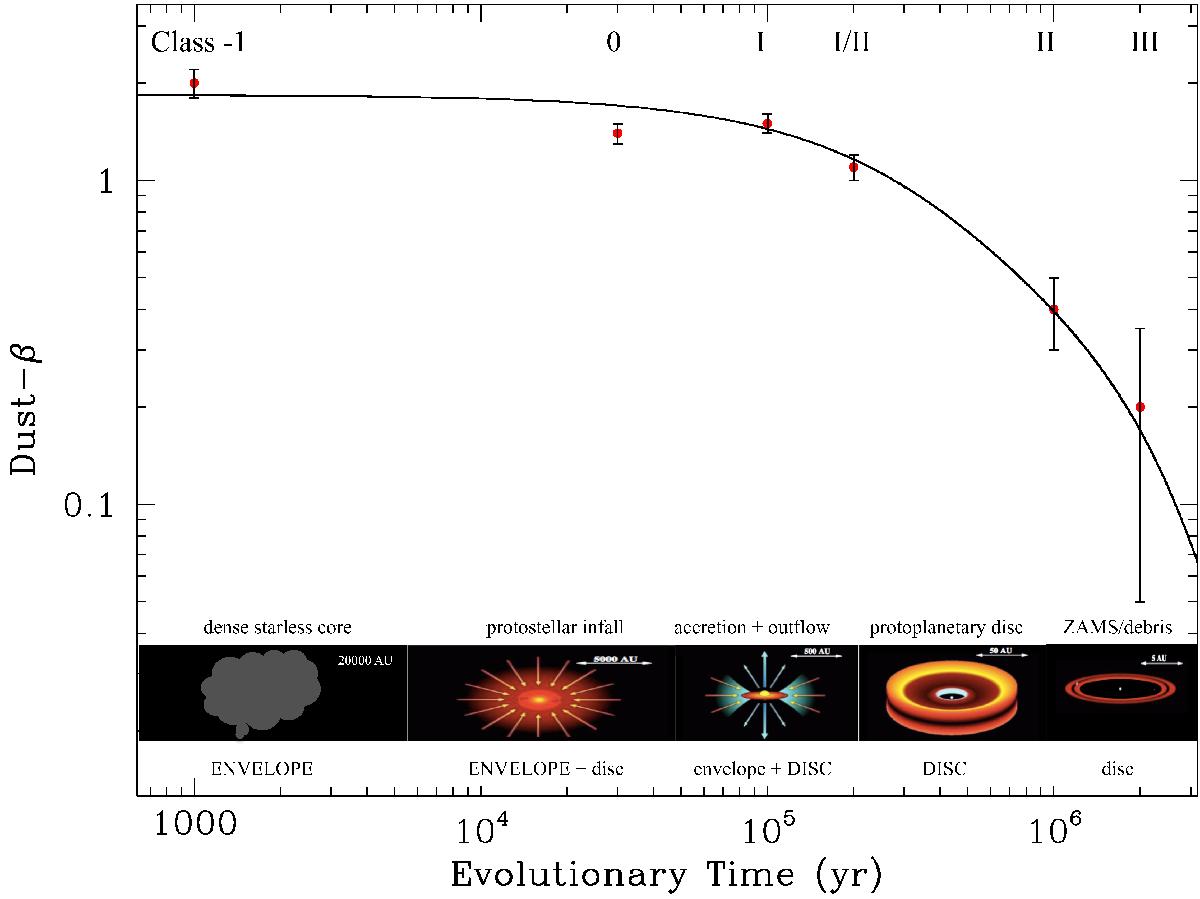
Dust opacity index β as a function of evolutionary time of star formation. β describes the frequency dependence of the dust opacity κν, dust in the Rayleigh-Jeans regime according to the power law κν, dust ∝ νβ. The cartoons are from McCoughrean/NASA/JWST. The major contributor to the dust emission at the various stages is indicated below the icons and the nature of the objects above them. The importance of a given contributor to the far-IR/submm emission is expressed in upper and lower case letters, respectively. The common nomenclature of stellar formation, labelled Class −1 through Class III, is shown above the data points with their 1σ errors. The line through the data points is an analytical fit of the form β(t) = a1 exp(−γ1t/τ) + a2 exp(−γ2t/τ), where τ = 5 × 10⁴ yr is a characteristic time scale, after which increased grain growth occurs in discs.
Current usage metrics show cumulative count of Article Views (full-text article views including HTML views, PDF and ePub downloads, according to the available data) and Abstracts Views on Vision4Press platform.
Data correspond to usage on the plateform after 2015. The current usage metrics is available 48-96 hours after online publication and is updated daily on week days.
Initial download of the metrics may take a while.