Fig. 12
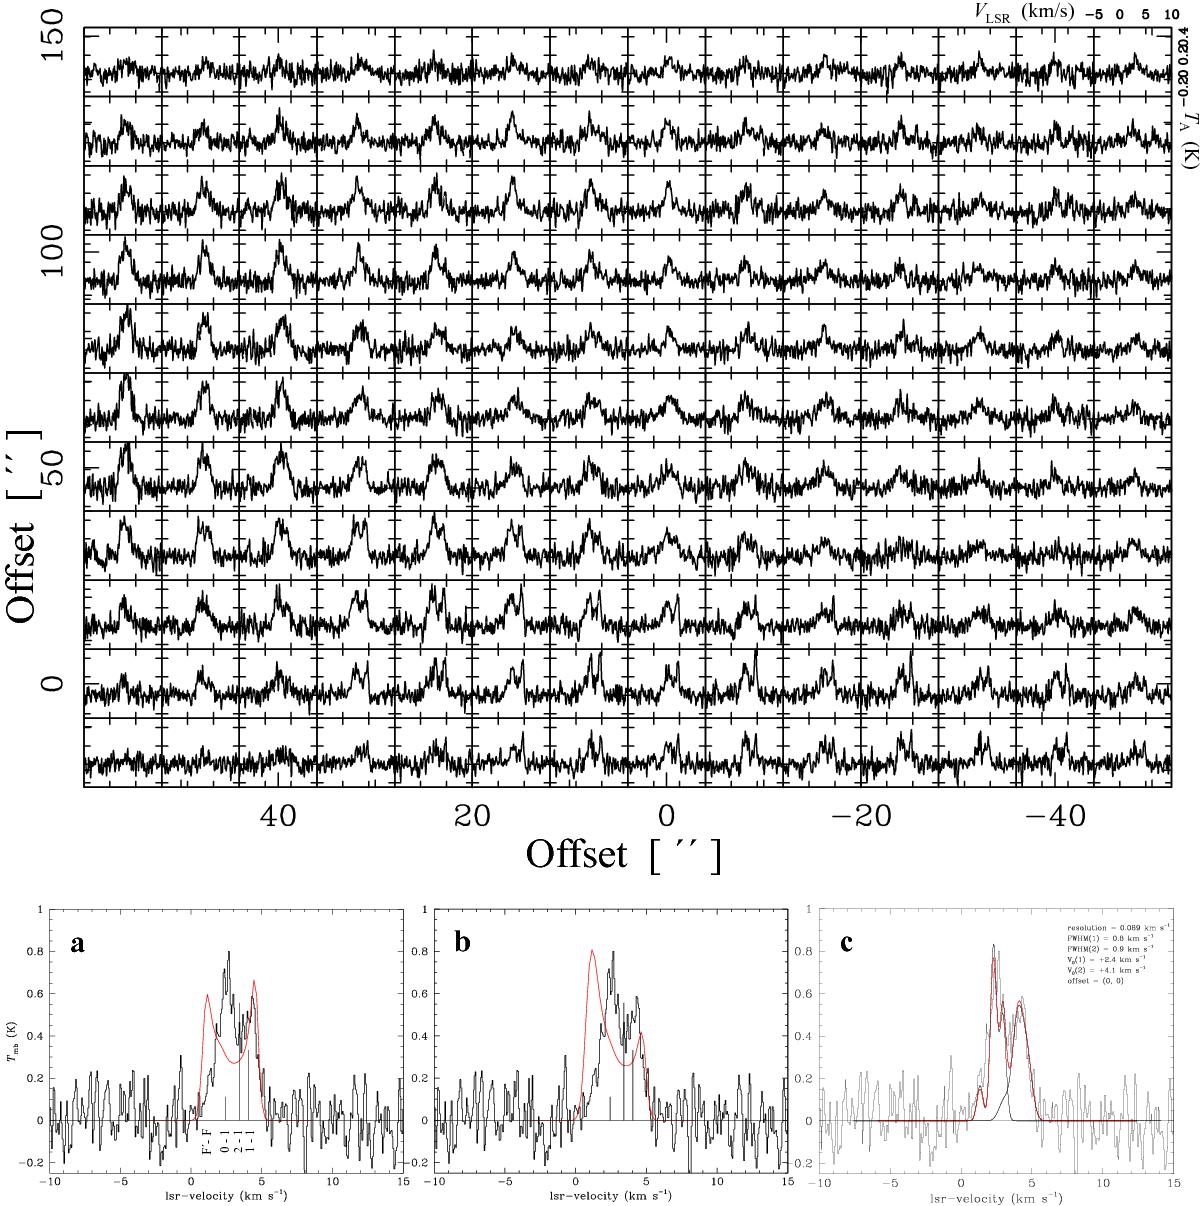
Upper: part of the observed Herschel-HIFI map in the ground state line of o-NH3; the scales are indicated in the upper right corner. Lower: observed high-resolution (HRS) NH3 (10−00) line profiles towards SM 1N shown as histograms. The red lines show a static BE model in a), whereas in b) an infall model is shown. The positions of the hfs components are shown as vertical bars, the lengths of which are normalized to 1.0, and their quantum numbers are indicated in a (see Appendix B). Panel c shows the results of Gaussian hfs profile fitting for two velocity components, the parameters of which are inscribed.
Current usage metrics show cumulative count of Article Views (full-text article views including HTML views, PDF and ePub downloads, according to the available data) and Abstracts Views on Vision4Press platform.
Data correspond to usage on the plateform after 2015. The current usage metrics is available 48-96 hours after online publication and is updated daily on week days.
Initial download of the metrics may take a while.