Fig. 1
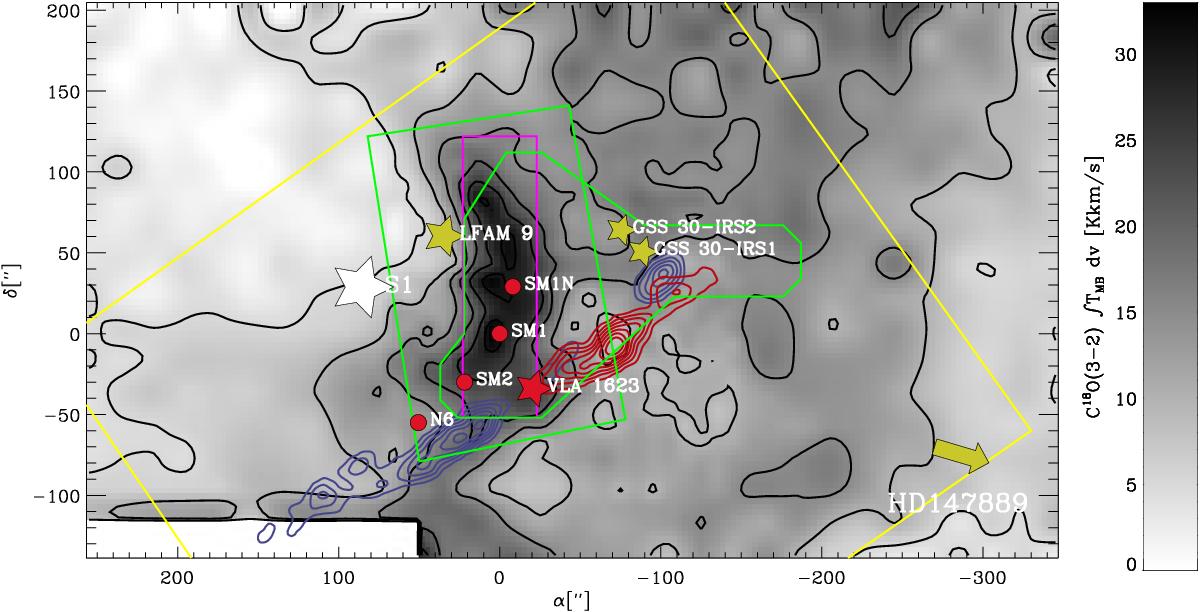
Regions of our Herschel observations in ρ Oph A are superposed onto a greyscale and contour map of C18O (3–2) integrated intensity; see scale bar to the right (Liseau et al. 2010). The region mapped with HIFI in H2O 557 GHz is shown by the large and partially cut rectangle (yellow; see also Fig. A.1) and that in H2O 1670 GHz by the small rectangle (magenta). The green rectangle outlines the region mapped with PACS in the [O I] 63, 145 μm lines and in the far-IR continuum. The green polygon marks the perimeter of the O2 487 GHz observations. Yellow stars identify Class I and II sources, the red star the Class 0 source VLA 1623, and the white star the early-type object S 1 (B4 + K, Gagné et al. 2004). An arrow points towards the 11′ distant early B star HD 147889. The red and blue contours refer to high-velocity gas seen in CO (3–2) emission (JCMT archive). Zero offset is at the position of SM 1, i.e. for J 2000 coordinates RA = 16h26m27![]() 9, Dec = −24°23′57′′.
9, Dec = −24°23′57′′.
Current usage metrics show cumulative count of Article Views (full-text article views including HTML views, PDF and ePub downloads, according to the available data) and Abstracts Views on Vision4Press platform.
Data correspond to usage on the plateform after 2015. The current usage metrics is available 48-96 hours after online publication and is updated daily on week days.
Initial download of the metrics may take a while.