Fig. 5
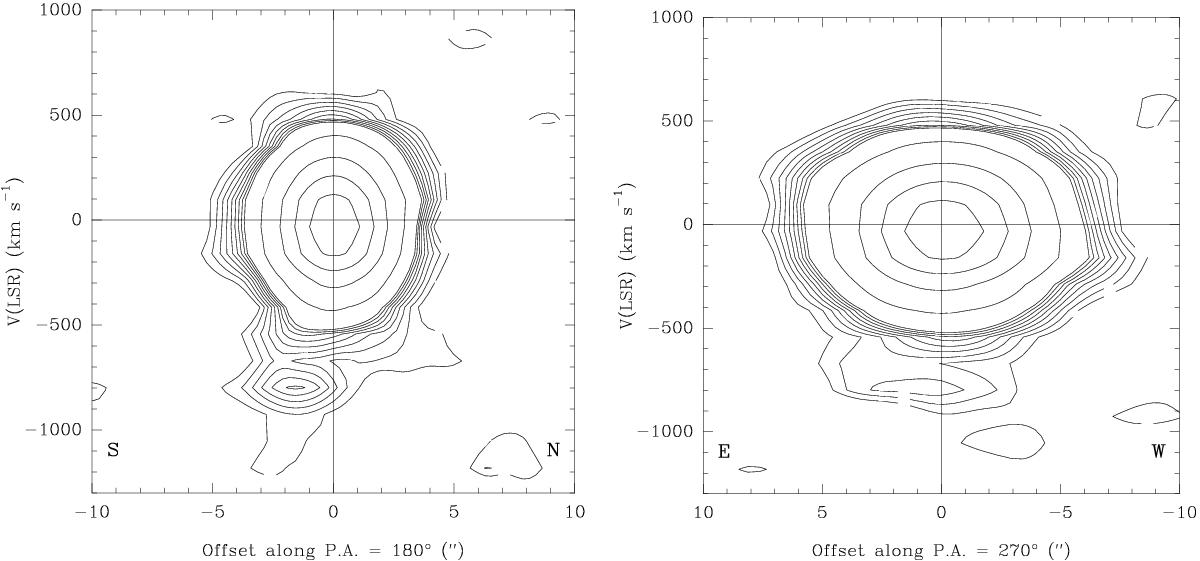
Position-velocity diagrams of the CO(4−3) emission line. Left panel: PV plot through the line connecting CO(4−3) peak position to the high velocity CO peak position, corresponding to a PA = 180 deg (i.e. south-north direction) is shown. Right panel: PV plot along a PA = 270 deg (west-east) is shown. Levels are from 2 to 10σ by 1σ, 20, 40, 60, 80, and 100σ, σ = 96 μJy/beam for 40 MHz. Each slice is 1 arcsec thick.
Current usage metrics show cumulative count of Article Views (full-text article views including HTML views, PDF and ePub downloads, according to the available data) and Abstracts Views on Vision4Press platform.
Data correspond to usage on the plateform after 2015. The current usage metrics is available 48-96 hours after online publication and is updated daily on week days.
Initial download of the metrics may take a while.