Fig. 4
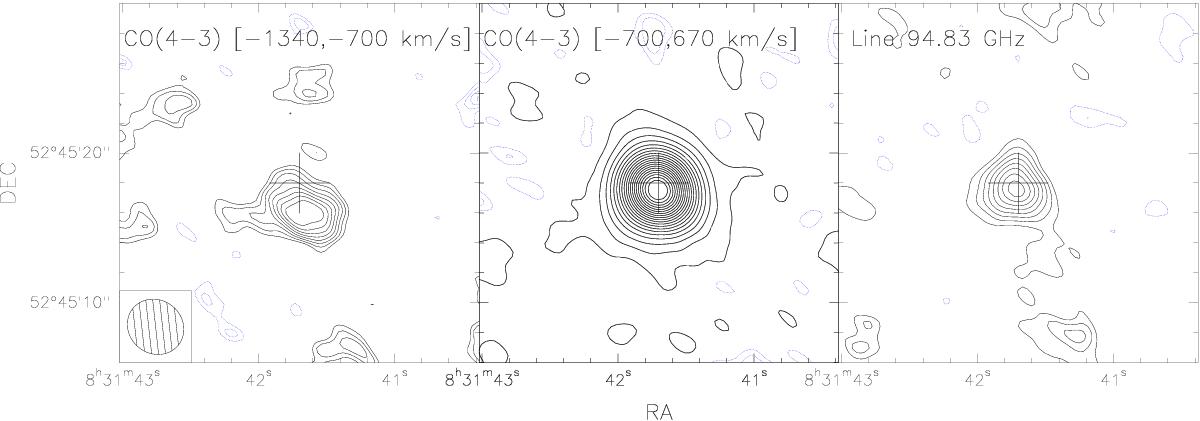
Left panel: blueshifted CO component is integrated between peakblue−2σblue = −1340 km s-1 and COsys−3σsys = −700 km s-1 (i.e. according to the Gaussian fit in Table 2). Levels start at ± 2σ and increase (decrease) by 0.5σ (σ = 39μJy/beam for an integrated bandwidth of 240 MHz = 767 km s-1). Middle panel: the CO systemic line integrated in the range Line−peak ± 3σ is shown. Levels start at ± 2σ and increase (decrease) by 5σ (σ = 27.7μJy/beam for 480 MHz (=1533 km s-1) integrated bandwidth). Right panel: the line at 93.85 GHz integrated in the range Line−peak ± 3σ is shown. Levels start at ± 2σ and increase (decrease) by 1σ (σ = 34μJy/beam per 320 MHz =1022 km s-1 integrated bandwidth). The cross denotes the phase tracking centre and is 4 × 4 arcsec wide.
Current usage metrics show cumulative count of Article Views (full-text article views including HTML views, PDF and ePub downloads, according to the available data) and Abstracts Views on Vision4Press platform.
Data correspond to usage on the plateform after 2015. The current usage metrics is available 48-96 hours after online publication and is updated daily on week days.
Initial download of the metrics may take a while.