Fig. 3
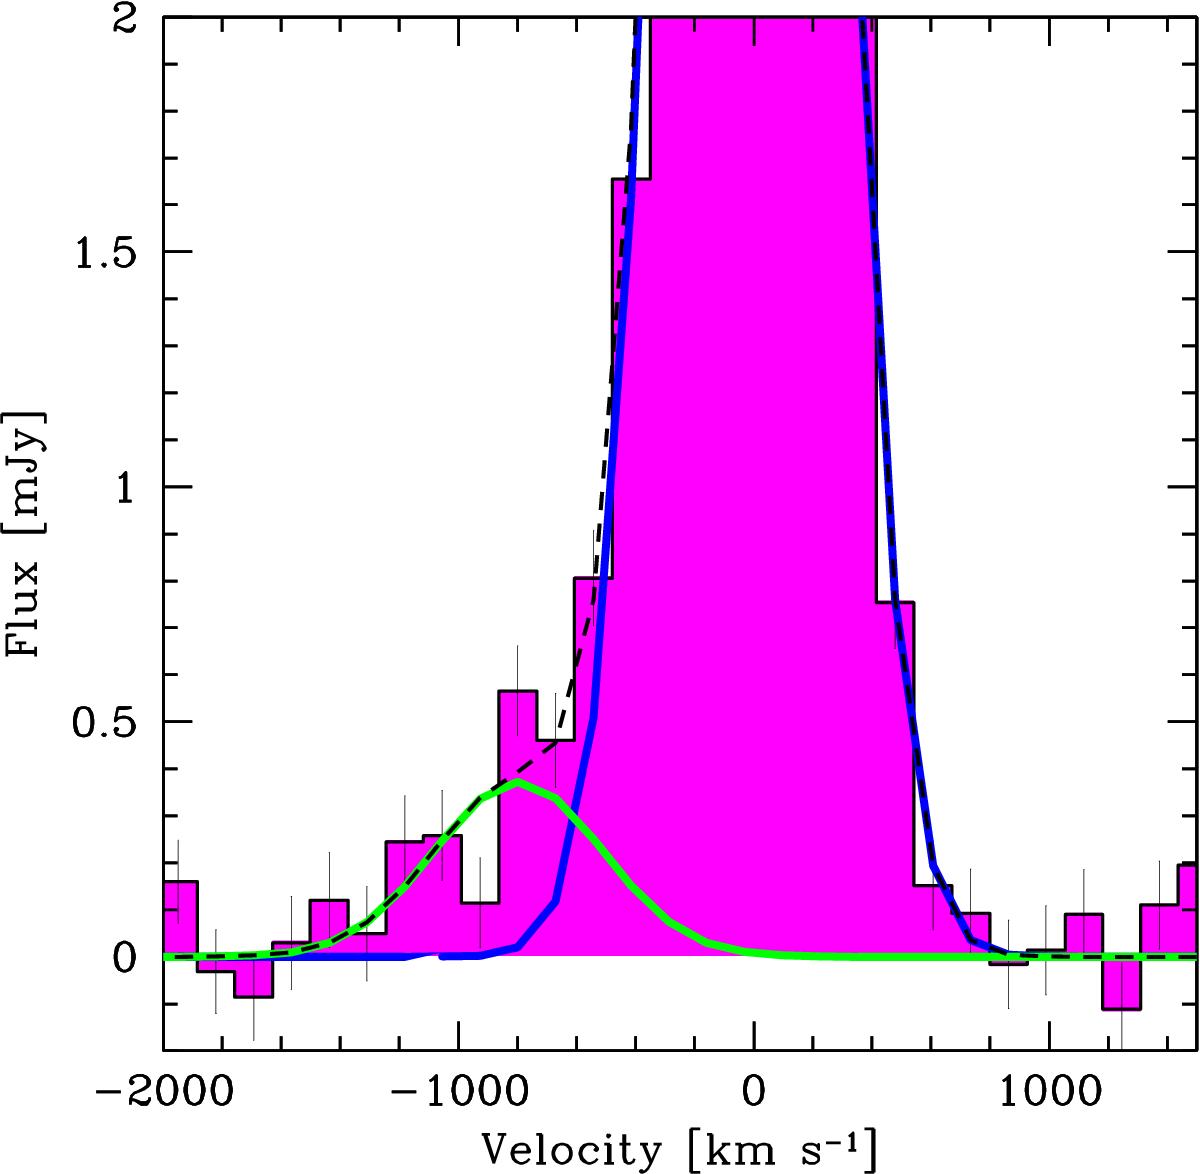
Zoom-in view of the spectrum around CO(4−3), integrated in a polygon set by the > 2σ noise level around the QSO. A double Gaussian fit was applied to CO(4−3), including a systemic (blue) and a blueshifted (green) line component. The dashed line shows the combination of the two Gaussian functions. The continuum was fitted with a linear function and subtracted as detailed in Sect. 3.2.
Current usage metrics show cumulative count of Article Views (full-text article views including HTML views, PDF and ePub downloads, according to the available data) and Abstracts Views on Vision4Press platform.
Data correspond to usage on the plateform after 2015. The current usage metrics is available 48-96 hours after online publication and is updated daily on week days.
Initial download of the metrics may take a while.