Fig. 2
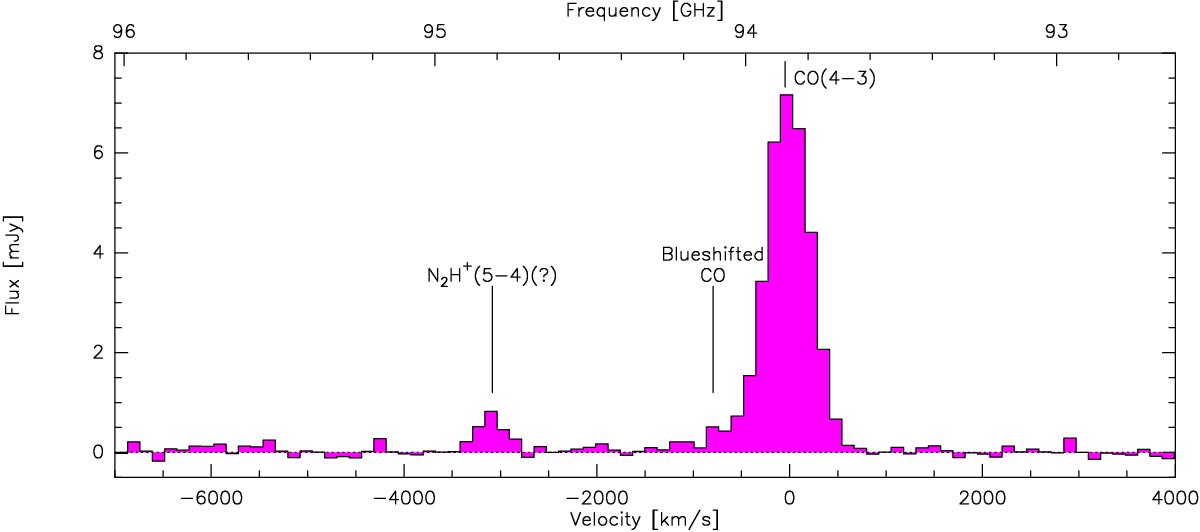
Full-bandwith spectrum of APM 08279 in the region around CO(4−3). The spectrum was spatially integrated over the source, after continuum subtraction, over a polygon around the source, determined by the 2σ contour level in a line map integrated over the velocity range −1340 to +670 km s-1. The observed frequency is reported on the upper x-axis. The continuum has been subtracted in the uv plane as detailed in Sect. 3.2. Labels marking spectral features are just to guide the eye. Actual line identifications are discussed in Sect. 4.
Current usage metrics show cumulative count of Article Views (full-text article views including HTML views, PDF and ePub downloads, according to the available data) and Abstracts Views on Vision4Press platform.
Data correspond to usage on the plateform after 2015. The current usage metrics is available 48-96 hours after online publication and is updated daily on week days.
Initial download of the metrics may take a while.