Fig. A.1
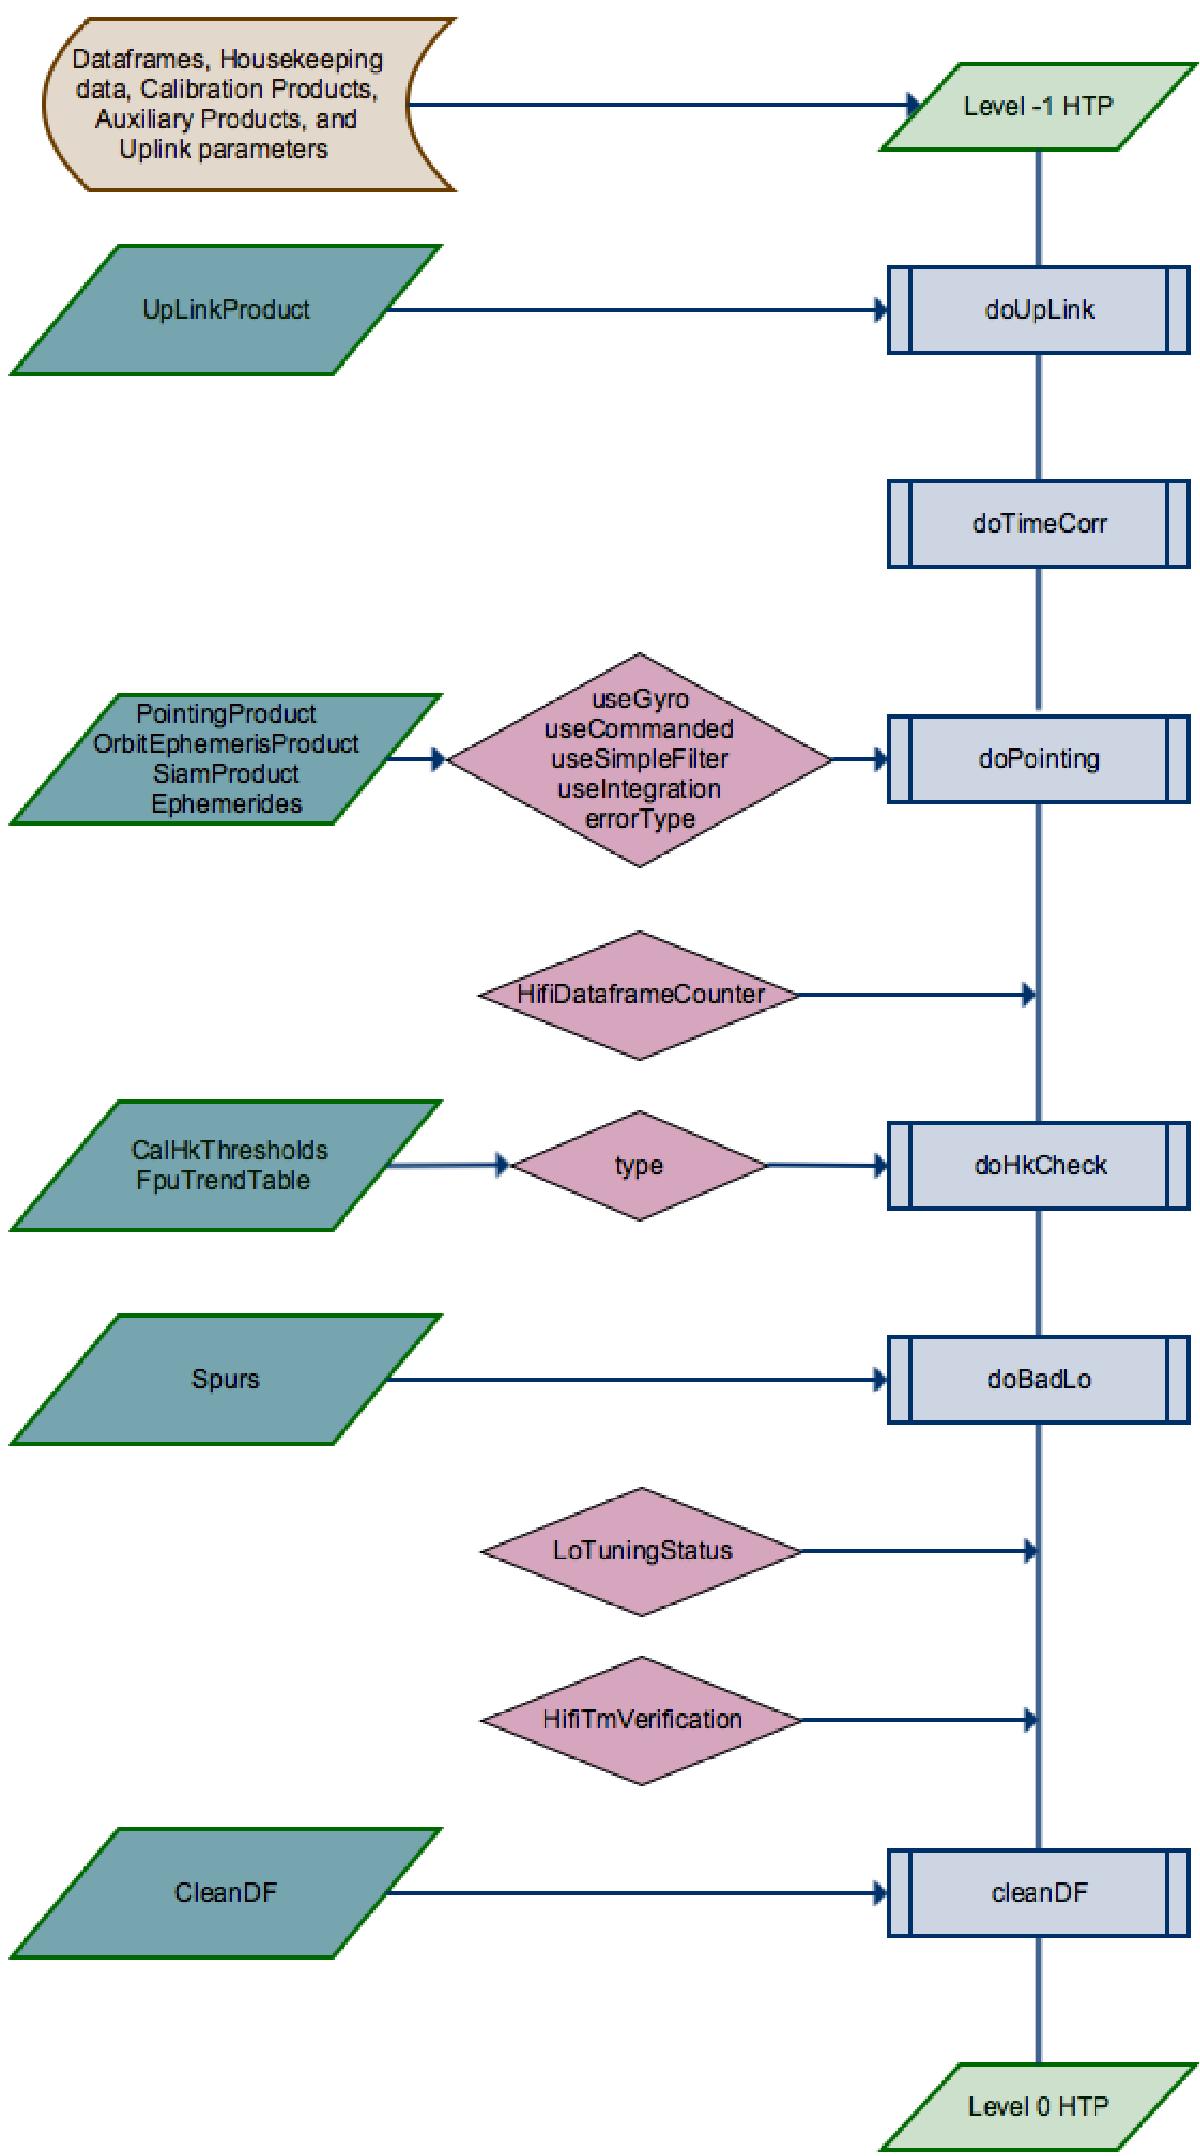
Level 0 pipeline diagram. The different shapes and colours have specific meanings. Pipeline tasks are identified in light blue rectangles. The beginning and ending products are shown as light green parallelograms. Calibration items are the dark green parallelograms. Calibration can be either obtained from the calibration tree or created by a pipeline step. Task options are identified within red rhombuses connected to a task. A red rhombus connected directly to the pipeline indicates a quality-check step.
Current usage metrics show cumulative count of Article Views (full-text article views including HTML views, PDF and ePub downloads, according to the available data) and Abstracts Views on Vision4Press platform.
Data correspond to usage on the plateform after 2015. The current usage metrics is available 48-96 hours after online publication and is updated daily on week days.
Initial download of the metrics may take a while.