Fig. A.4
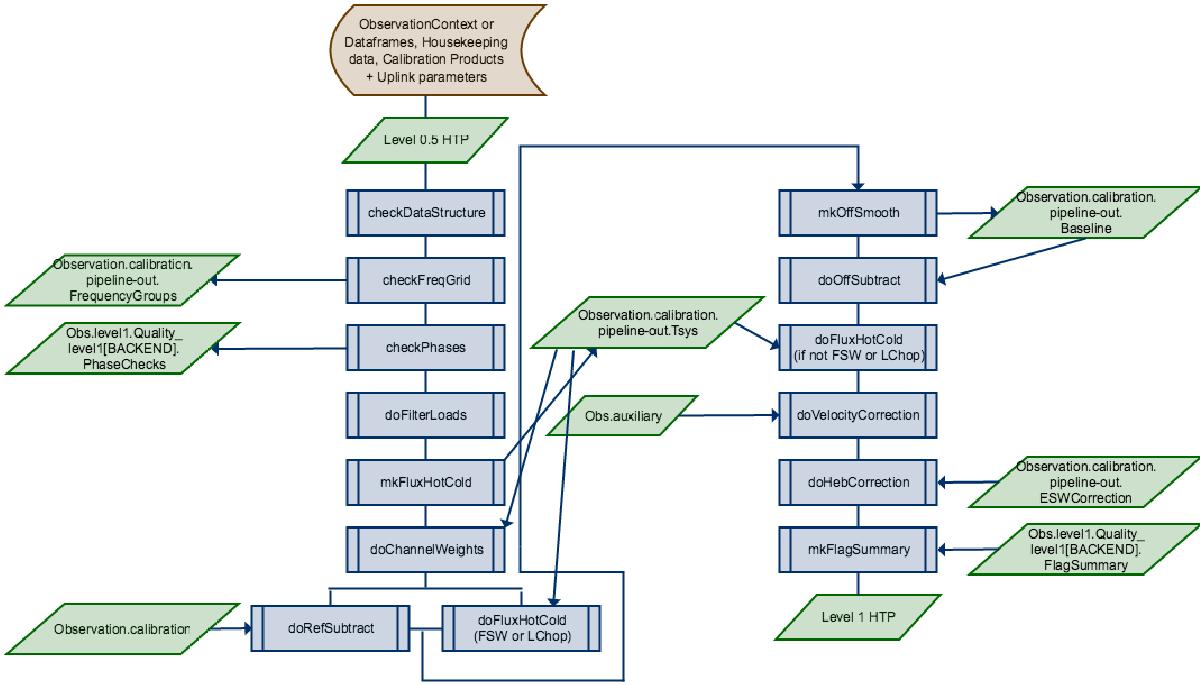
Level 1 pipeline flow diagram. The Level 1 pipeline uses the results of the Level 0.5 pipelines and processes the two backend in the same fashion. This and the Level 2 pipelines are also often called the GenericPipeline. The Level 0.5 results were removed from the ObservationContext to save disk space. The symbols and colours have the same meaning as for the Level 0 pipeline in Fig. A.1.
Current usage metrics show cumulative count of Article Views (full-text article views including HTML views, PDF and ePub downloads, according to the available data) and Abstracts Views on Vision4Press platform.
Data correspond to usage on the plateform after 2015. The current usage metrics is available 48-96 hours after online publication and is updated daily on week days.
Initial download of the metrics may take a while.