Free Access
Fig. 1
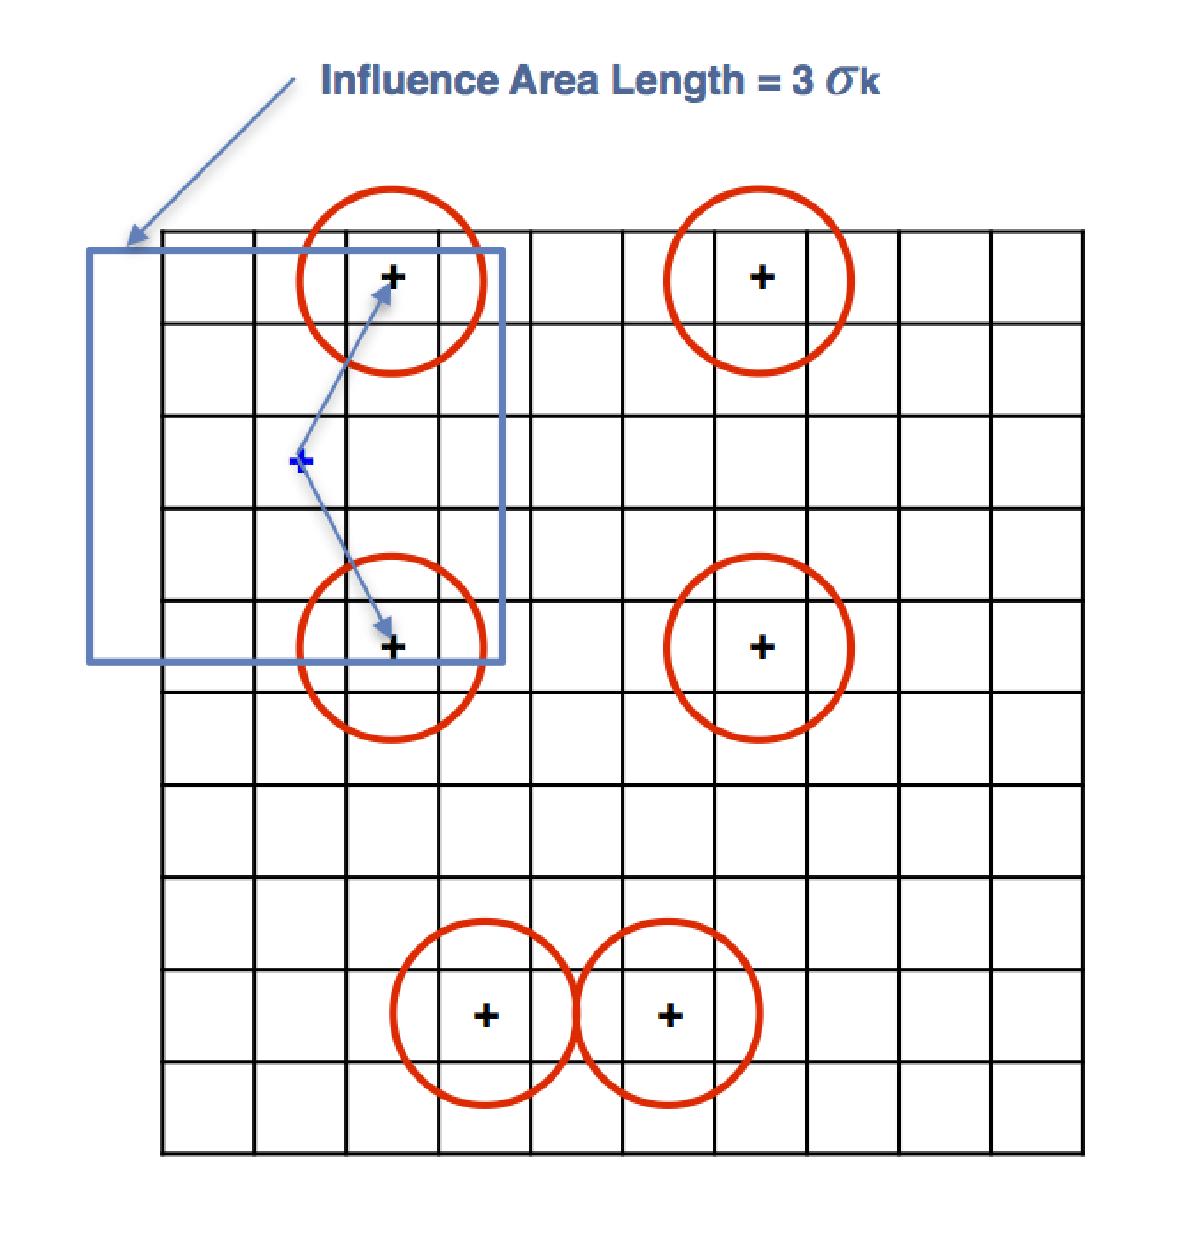
Schematic representation of the convolution of spectral map points onto a regular grid by the doGridding task. The pluses represent map readout points with the HPBW represented by red circles, and the blue squares represent an influence area.
Current usage metrics show cumulative count of Article Views (full-text article views including HTML views, PDF and ePub downloads, according to the available data) and Abstracts Views on Vision4Press platform.
Data correspond to usage on the plateform after 2015. The current usage metrics is available 48-96 hours after online publication and is updated daily on week days.
Initial download of the metrics may take a while.