Fig. 8
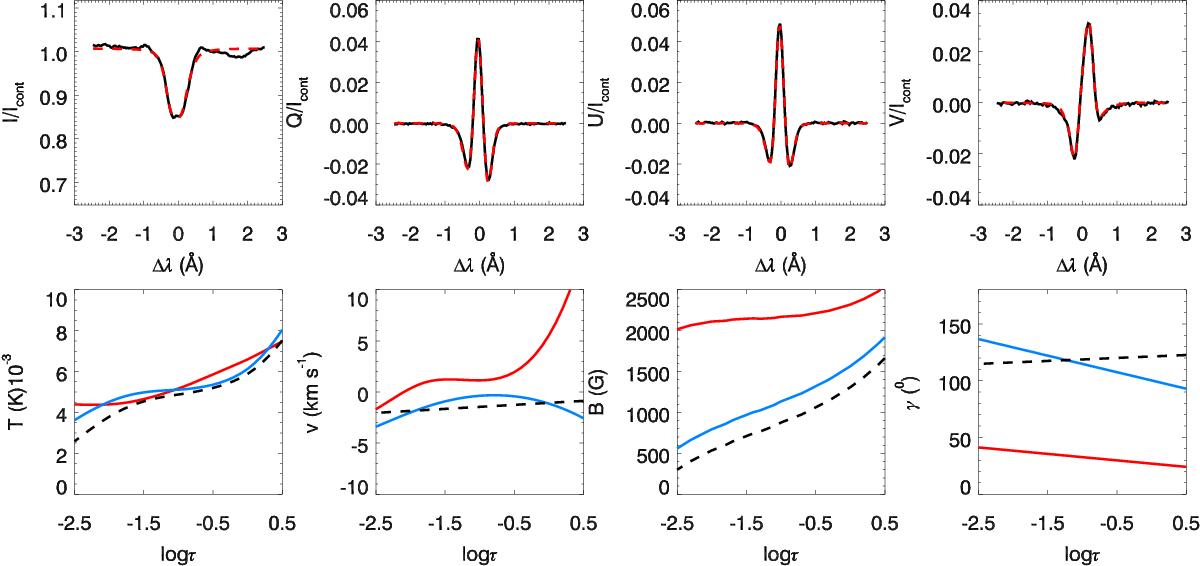
Top: Stokes profiles of the Fe i 15 652.9 Å line at the position indicated by the blue arrow in panel a of Fig. 6 for the third GRIS map (black line) and the best fit obtained from a two-magnetic-components inversion with SIR (red dashed lines). Bottom: stratification in temperature, Doppler velocity, magnetic field strength, and magnetic field inclination obtained at the same position from the first GRIS map (black dashed line), and the inversion of the third GRIS map for the first component (red, filling factor 0.15) and second component (blue, filling factor 0.85).
Current usage metrics show cumulative count of Article Views (full-text article views including HTML views, PDF and ePub downloads, according to the available data) and Abstracts Views on Vision4Press platform.
Data correspond to usage on the plateform after 2015. The current usage metrics is available 48-96 hours after online publication and is updated daily on week days.
Initial download of the metrics may take a while.