Fig. 6
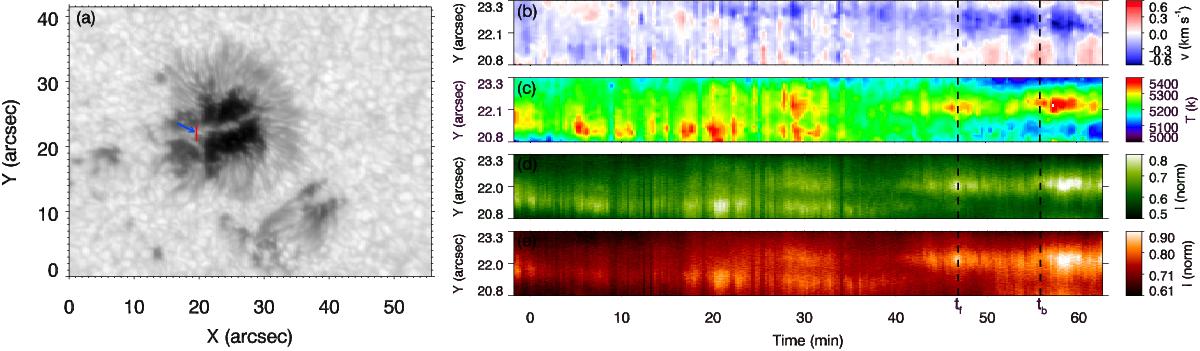
Left panel: broad-band MOMFBD reconstructed image from GFPI at 09:58 UT. Right panels: temporal evolution of the Doppler velocity (b) and temperature (c) at log τ = −0.6 inferred from the inversion of the Fe i 6173 Å line (GFPI data), and the intensity evolution in G-band (d) and Ca ii H(e) from HiFI at the position indicated by a red line in panel a. Time is indicated in minutes after 09:00 UT. The vertical dashed line denoted as tf marks the time of the beginning of the flare and the dashed line tb indicates the arrival of the plasma blob to the light bridge. The blue arrow in panel a points to the location of the spectra illustrated in Figs. 7 and 8.
Current usage metrics show cumulative count of Article Views (full-text article views including HTML views, PDF and ePub downloads, according to the available data) and Abstracts Views on Vision4Press platform.
Data correspond to usage on the plateform after 2015. The current usage metrics is available 48-96 hours after online publication and is updated daily on week days.
Initial download of the metrics may take a while.