Fig. 5
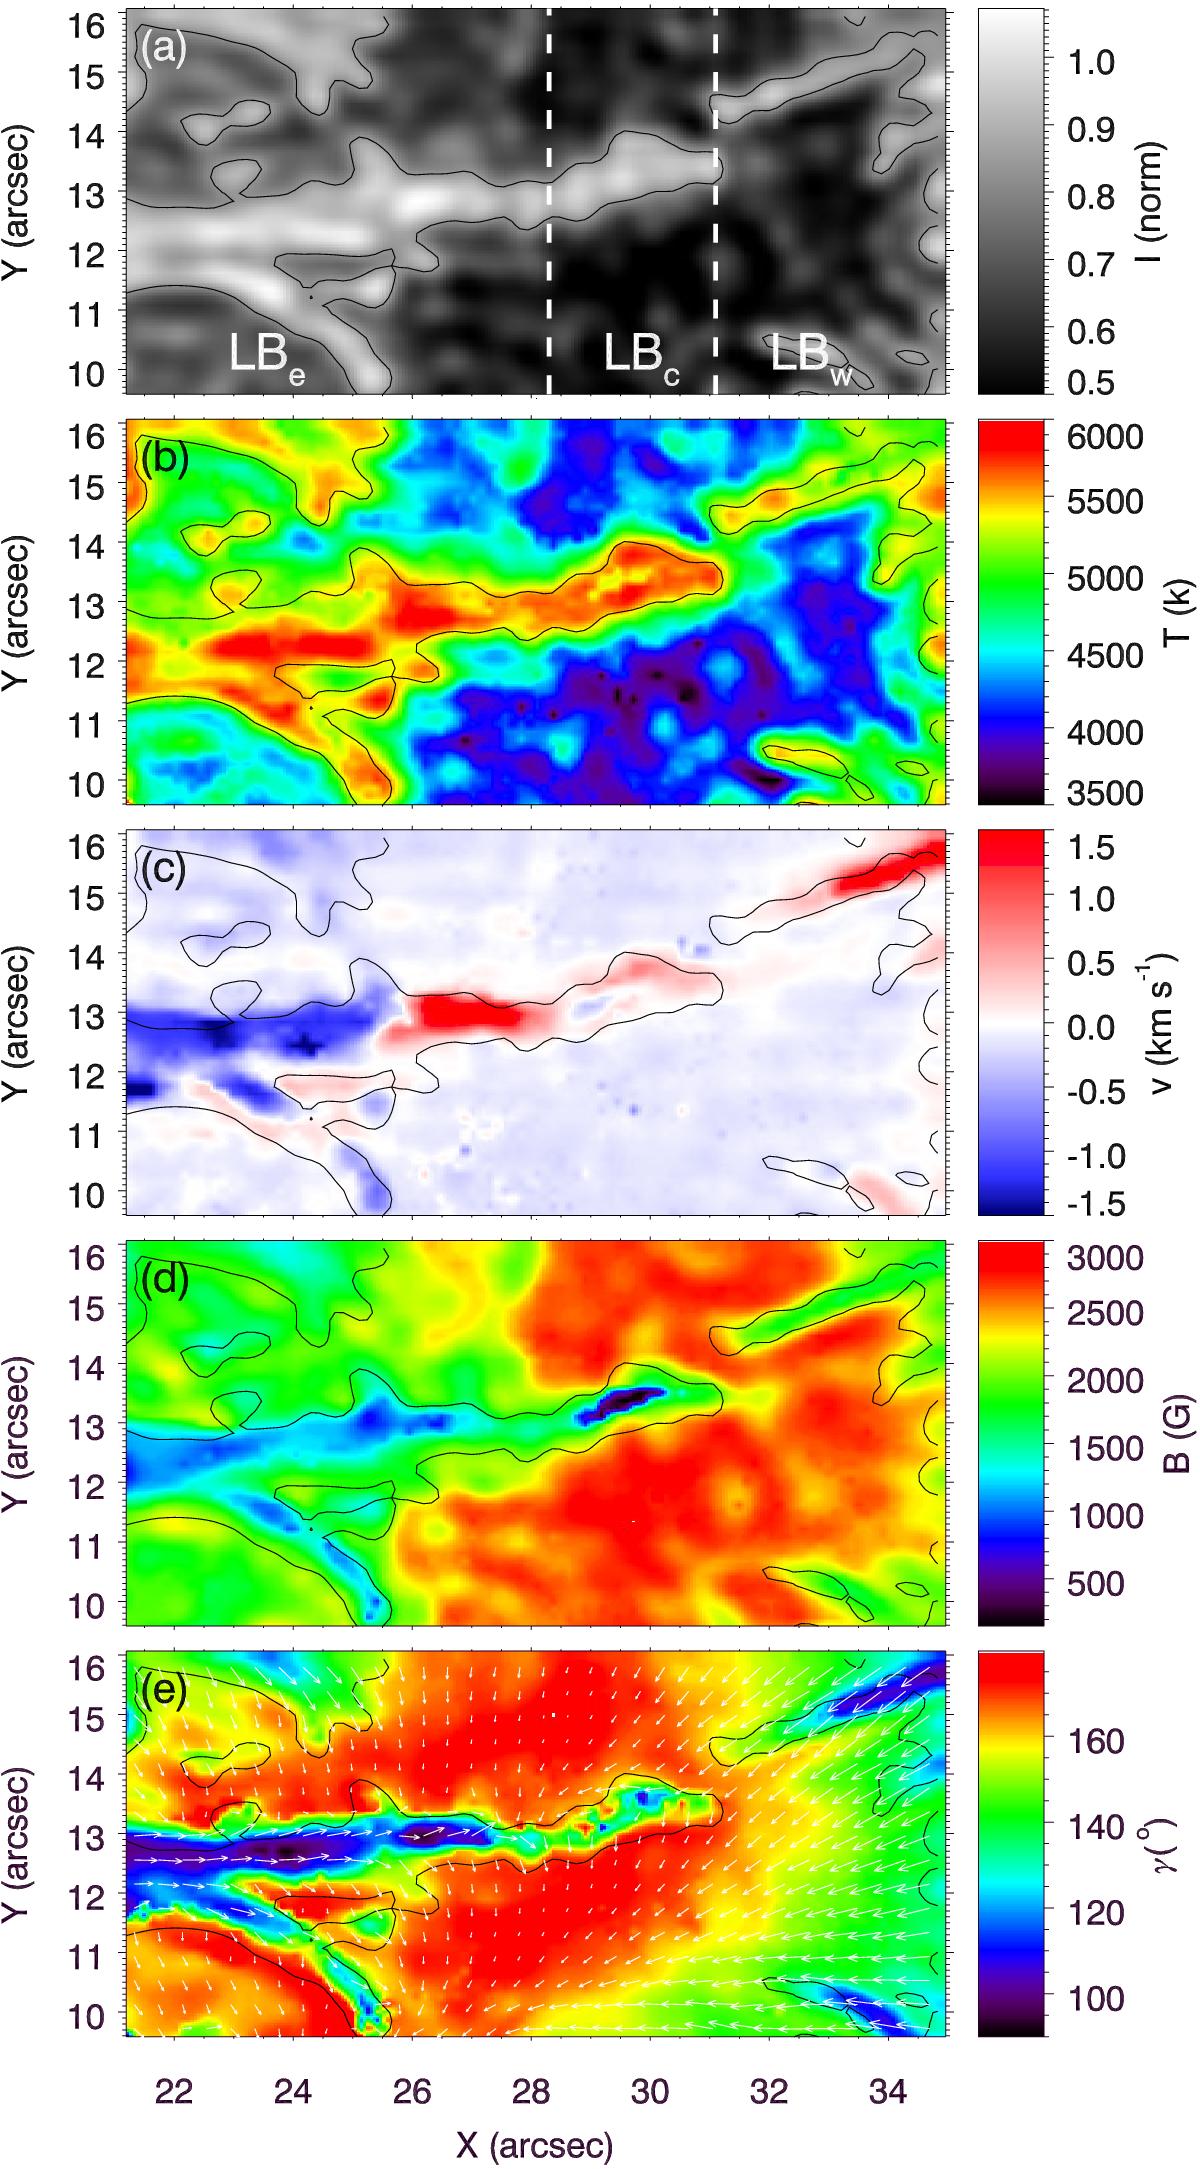
Maps of deconvolved continuum intensity (a); temperature (b); LOS velocity (c); magnetic field strength (d); and magnetic field inclination measured from the local radial direction (e) of the light bridge measured in the first scan (from 09:41 to 09:49 UT) of GREGOR/GRIS data. Panels b–e illustrate the results of simultaneous inversions of four infrared Fe i lines at log τ = −0.5 with SIR. White arrows in panel e indicate the orientation of the magnetic field in the horizontal plane, with their length proportional to the horizontal field strength. Black lines show contours of constant continuum intensity.
Current usage metrics show cumulative count of Article Views (full-text article views including HTML views, PDF and ePub downloads, according to the available data) and Abstracts Views on Vision4Press platform.
Data correspond to usage on the plateform after 2015. The current usage metrics is available 48-96 hours after online publication and is updated daily on week days.
Initial download of the metrics may take a while.