Fig. 4
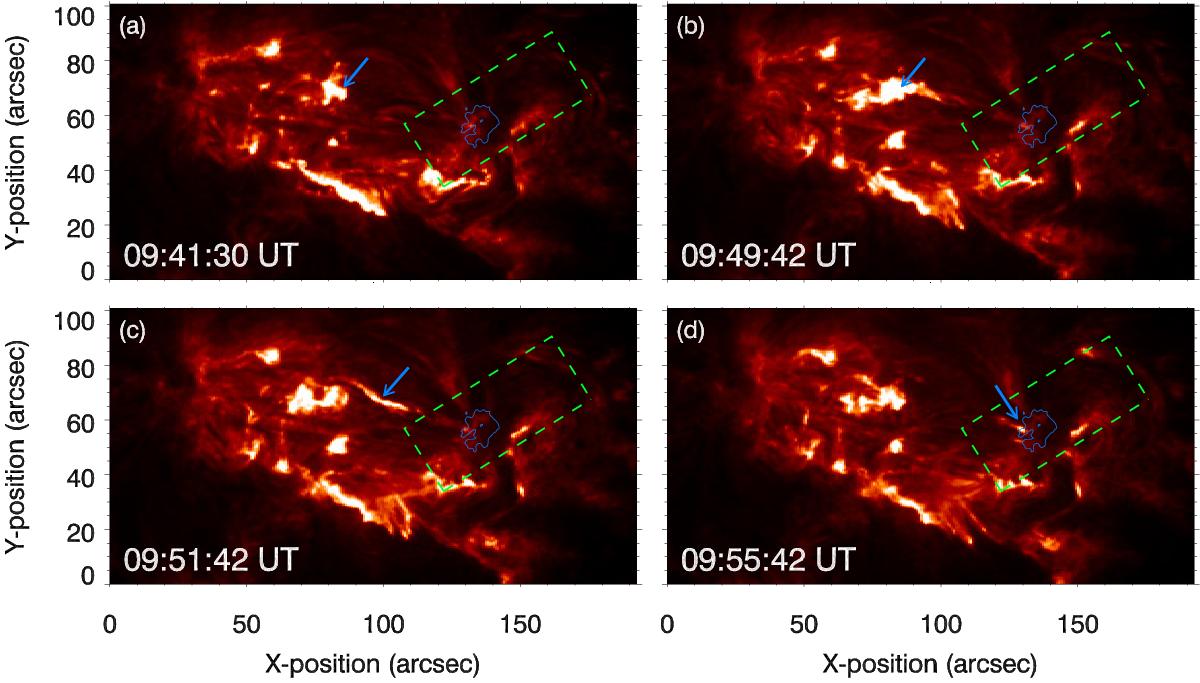
SDO/AIA 304 Å filtergrams of active region NOAA 12544 at four time steps around the occurrence of a C1.3 flare. The dashed green line is the FOV of GREGOR/GRIS data. The solid blue line represents the contour of the umbra as seen in HMI continuum images. The blue arrow points to the origin of the flare in the top panels and to the position of the ejected plasma blob in the bottom panels.
Current usage metrics show cumulative count of Article Views (full-text article views including HTML views, PDF and ePub downloads, according to the available data) and Abstracts Views on Vision4Press platform.
Data correspond to usage on the plateform after 2015. The current usage metrics is available 48-96 hours after online publication and is updated daily on week days.
Initial download of the metrics may take a while.