Fig. 5
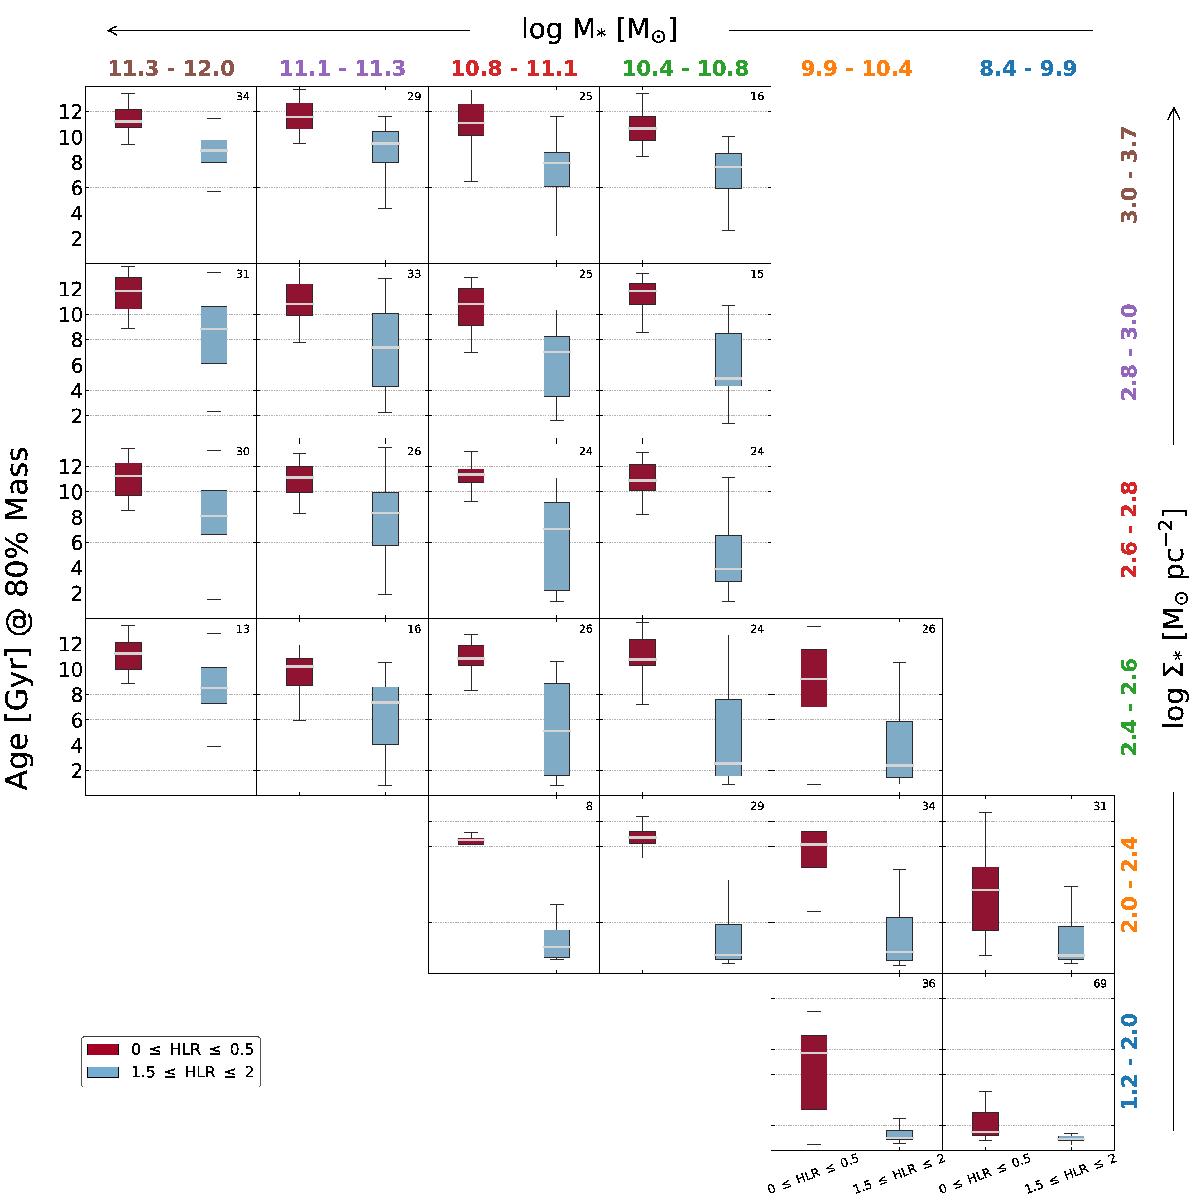
Box plot diagram of the age (in Gyr) at which the inner (≤0.5 HLR) and outer (1.5 ≤ HLR ≤ 2) spatial regions grow to 80% of their final stellar mass stacked by stellar mass and stellar mass surface density. The gray horizontal line in each box plot shows the median of the distribution. The upper right number in each panel indicates the number of galaxies stacked for that particular bin.
Current usage metrics show cumulative count of Article Views (full-text article views including HTML views, PDF and ePub downloads, according to the available data) and Abstracts Views on Vision4Press platform.
Data correspond to usage on the plateform after 2015. The current usage metrics is available 48-96 hours after online publication and is updated daily on week days.
Initial download of the metrics may take a while.