Fig. 3
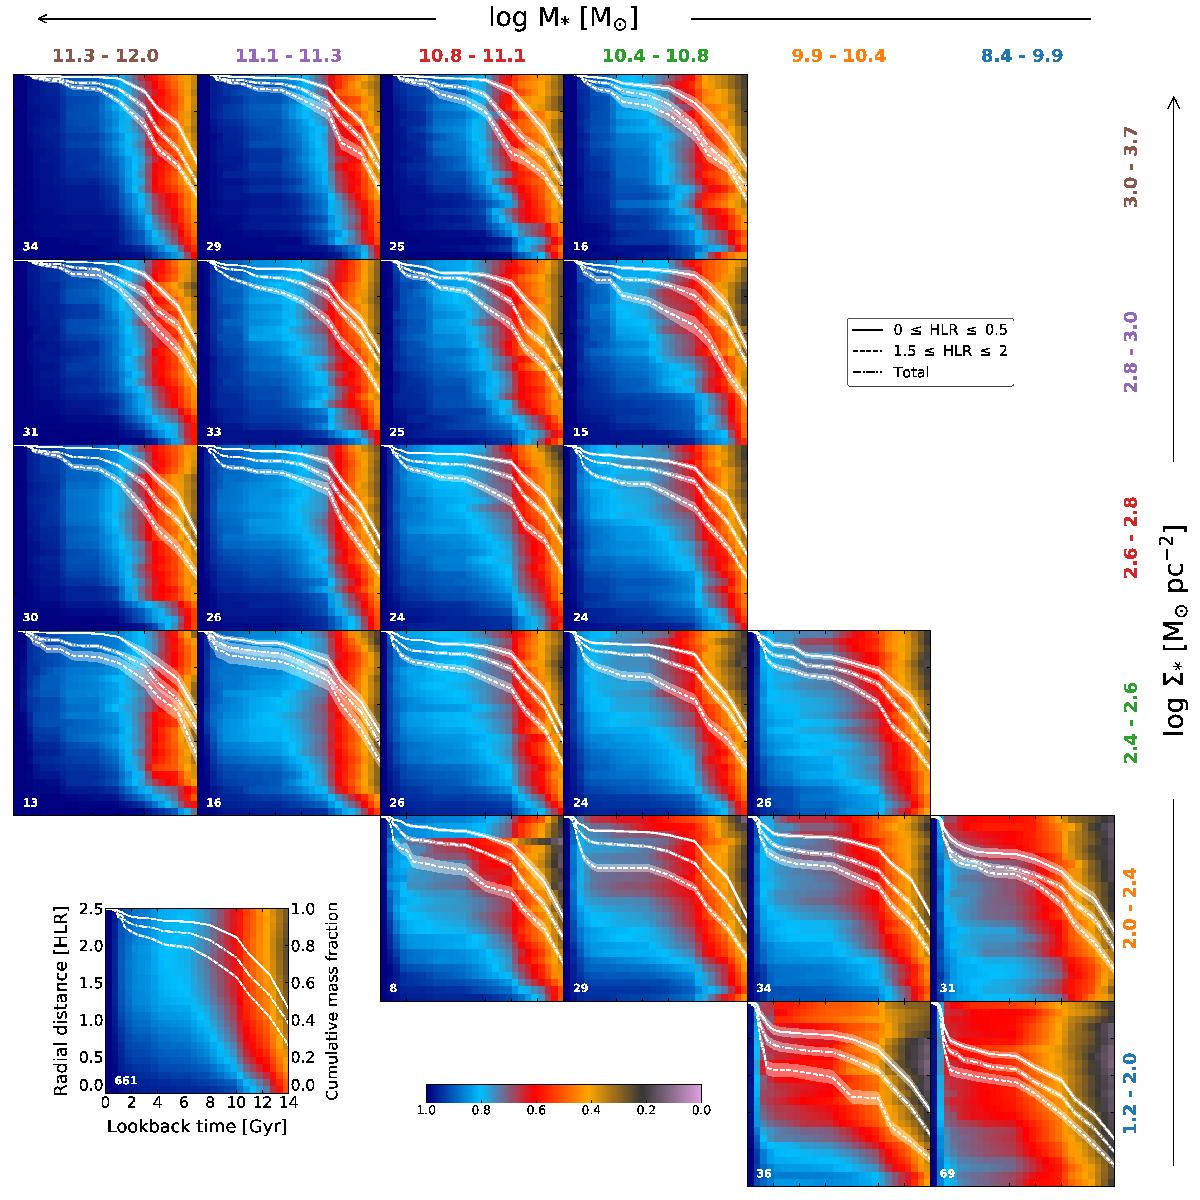
Radial stellar mass growth maps up to 2.5 HLR stacked by stellar mass and stellar mass surface density. Each radial bin is normalized to its final M⋆. Lines overplotted on the 2D maps represent the relative stellar mass growth of three main spatial regions (white): inner 0.5 HLR (solid line), 1.5 ≤ HLR ≤ 2 (dashed line), and total (dash-dotted line). The (white) shaded areas represent the standard deviation of the mean. The lower left number in each map indicates the number of galaxies stacked for that particular bin. The lower-left inset box shows the results for all 661 galaxies. Mass and stellar mass surface density bins grow from right to left and bottom to top, respectively.
Current usage metrics show cumulative count of Article Views (full-text article views including HTML views, PDF and ePub downloads, according to the available data) and Abstracts Views on Vision4Press platform.
Data correspond to usage on the plateform after 2015. The current usage metrics is available 48-96 hours after online publication and is updated daily on week days.
Initial download of the metrics may take a while.