Fig. 1
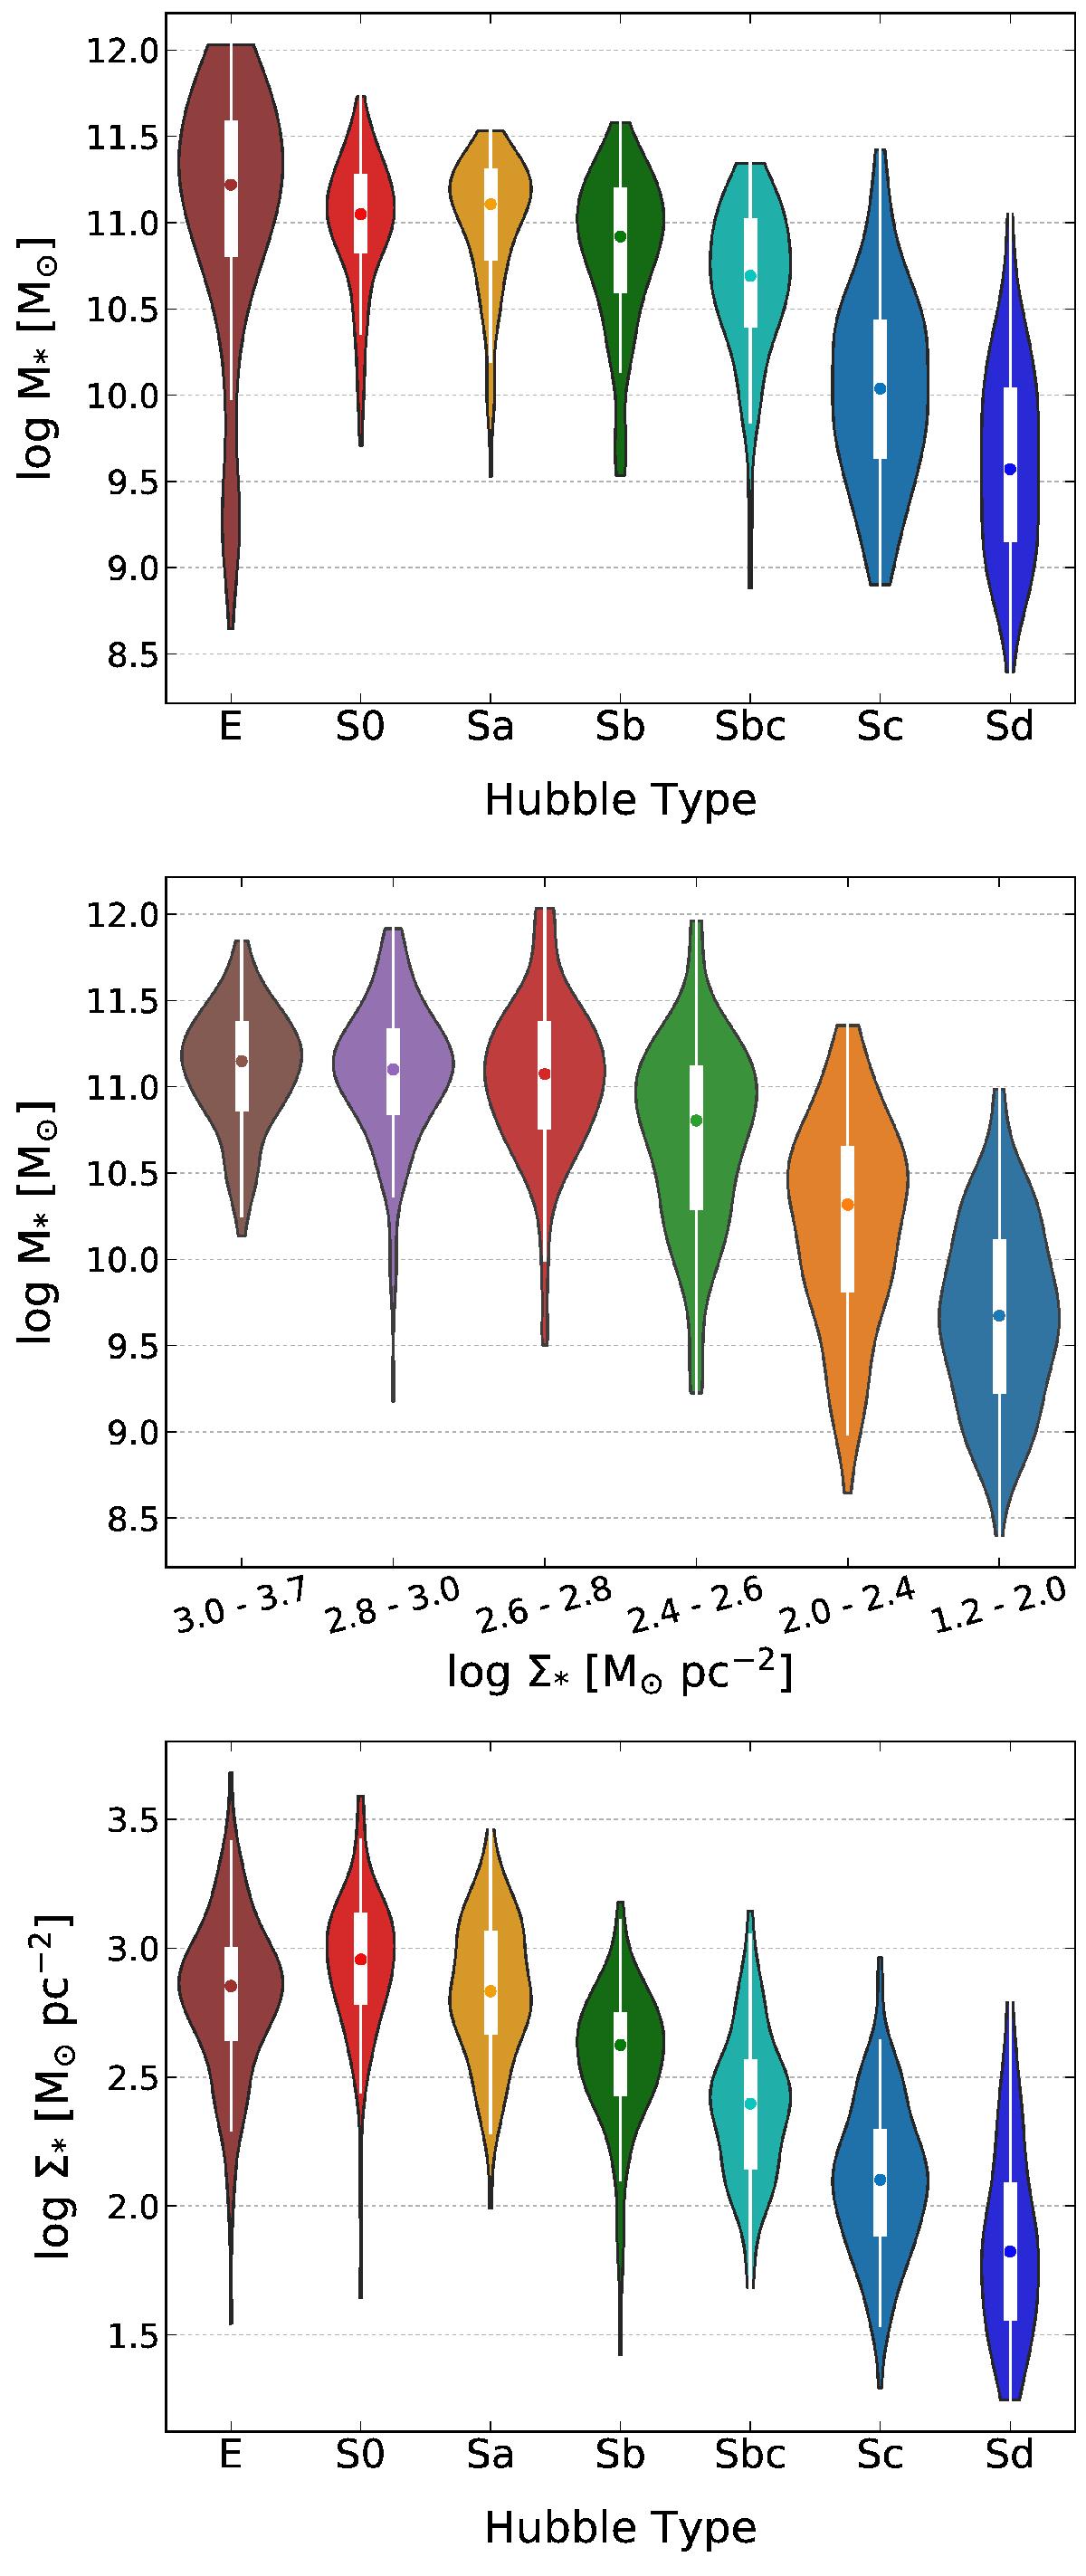
Violin plots of the stellar masses for each Hubble type (upper panel), stellar masses for each stellar mass surface density bin (middle panel), and stellar mass surface density for each Hubble type (bottom panel). Its corresponding box plot showing the interquartile range is plotted inside each violin plot. The inner dot in the box plot represents the median of the distribution. The values of the stellar mass surface density were obtained at 1 HLR (see Sect. 3.3). The width of the “violins” are scaled by the number of observations in each bin.
Current usage metrics show cumulative count of Article Views (full-text article views including HTML views, PDF and ePub downloads, according to the available data) and Abstracts Views on Vision4Press platform.
Data correspond to usage on the plateform after 2015. The current usage metrics is available 48-96 hours after online publication and is updated daily on week days.
Initial download of the metrics may take a while.