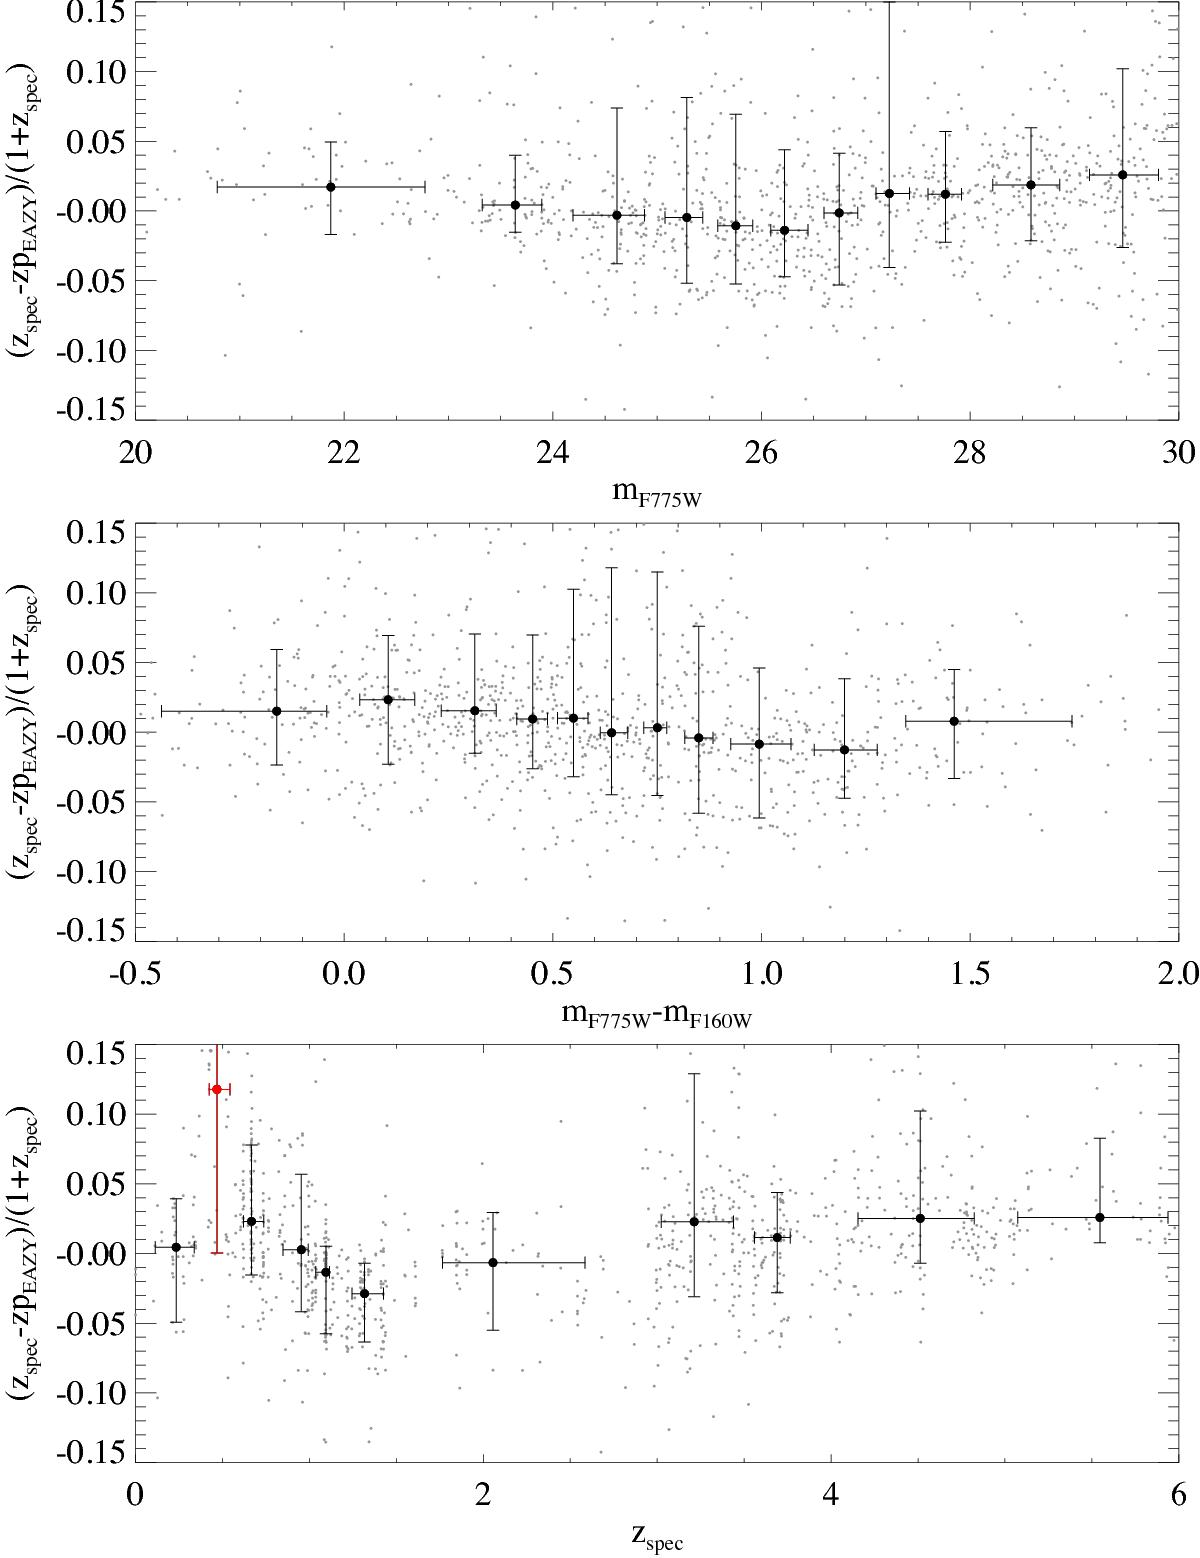
Fig. 8

Illustration of the performance of the best-performing EAZY template set, namely v1.3 with all possible combinations of templates. Top panel: normalised redshift difference as a function of the F775W magnitude with the points plotted at the average magnitude and the median difference in each bin, and the error bars indicating the 16th and 84th percentiles of the distributions in x and y. The red points with error bars are shown where the outlier fraction exceeds 15%. Middle panel: same, but now plotted as a function of the observed F775W – F160W colour, and final panel: same but against the spectroscopic redshift. Note the one bin near z = 0.4 with very discrepant bias.
Current usage metrics show cumulative count of Article Views (full-text article views including HTML views, PDF and ePub downloads, according to the available data) and Abstracts Views on Vision4Press platform.
Data correspond to usage on the plateform after 2015. The current usage metrics is available 48-96 hours after online publication and is updated daily on week days.
Initial download of the metrics may take a while.


