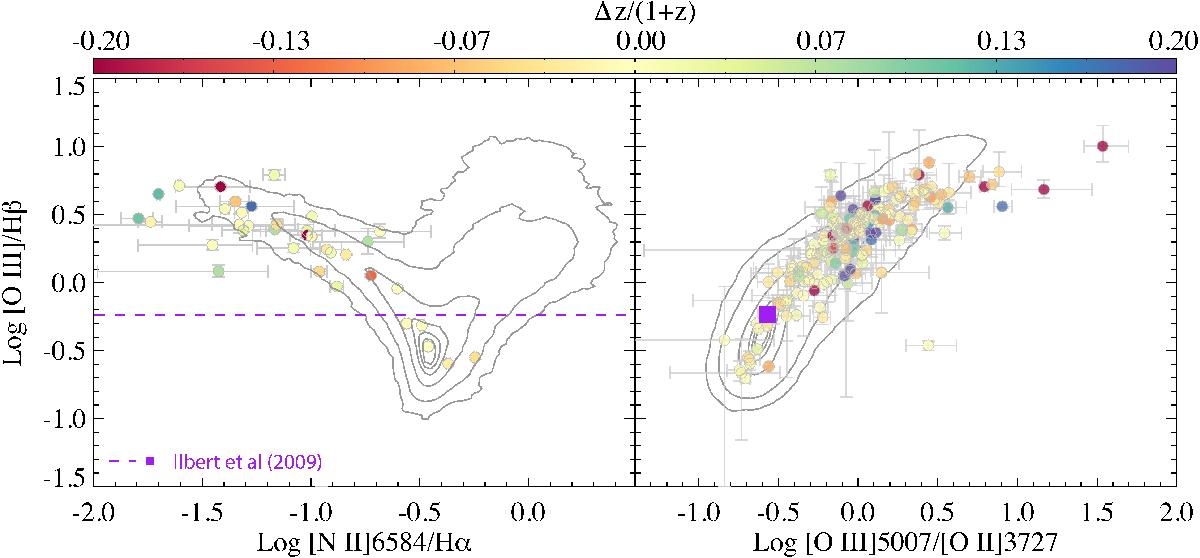
Fig. 20

Left panel: the BPT [Nii] λ6584/Hα vs. [Oiii] λ5007/Hβ diagram. The location of SDSS galaxies is shown by the grey contours with the outermost contour encolosing 99% of the galaxies. The MUSE UDF sources are plotted in top with colour encoding the discrepancy between BPZ photometric and spectroscopic redshift as given by the colour key on top. Right panel: [Oiii] λ5007/[Oii] λ3727 vs. [Oiii] λ5007/Hβ diagram (see also Paalvast et al., in prep.) showing the same. The purple line and square shows the line ratios proposed for photo-z work by Ilbert et al. (2009).
Current usage metrics show cumulative count of Article Views (full-text article views including HTML views, PDF and ePub downloads, according to the available data) and Abstracts Views on Vision4Press platform.
Data correspond to usage on the plateform after 2015. The current usage metrics is available 48-96 hours after online publication and is updated daily on week days.
Initial download of the metrics may take a while.


