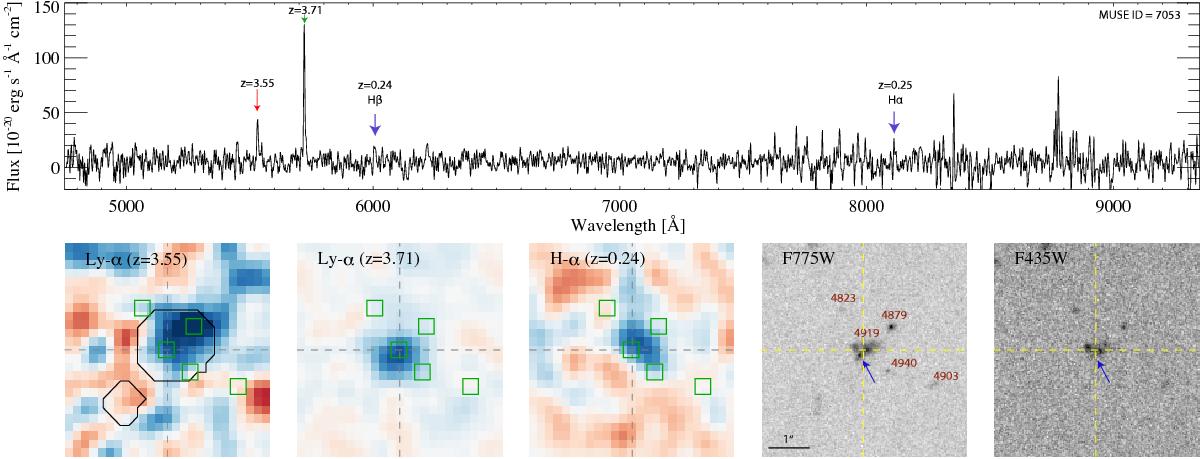
Fig. 2

Spectrum and narrow band images of the main spectral features of MUSE ID 7053. Top panel: spectrum, smoothed with a 2.5 Å Gaussian. There are spectral features from three distinct galaxies in this spectrum, the locations of which are indicated by the small arrows. The bluest feature is a Ly-α line from RAF 4879 (MUSE ID 3052), at z = 3.55. The narrow-band image over this feature, smoothed with a 3-pixel FWHM Gaussian and with side-bands subtracted off, is shown in the lower left panel. This panel also shows the segmentation map for this object as the black contours. This and the other images are 5′′ on the side. The green squares show the locations of the objects in the R15 catalogue that are labelled in the F775W image. The next feature is a Ly-α line at z = 3.71 (MUSE ID 7386) whose narrow-band image is shown in the second panel from the left in the bottom row. Finally the main bulk galaxy in the image has weak Hα and Hβ at z = 0.24. The combined narrow-band image of Hα and Hβ is shown in the middle panel on the bottom row. Last two panels on the bottom row: HST F775W and F435W images with an asinh scale. The object most likely associated to the z = 3.71 Ly-α is indicated by the blue arrow. The central four objects from the R15 catalogue are labelled with their IDs in the R15 catalogue in the F775W image and the cross-hairs in each of the lower panels crosses at the same spatial position to help compare different panels.
Current usage metrics show cumulative count of Article Views (full-text article views including HTML views, PDF and ePub downloads, according to the available data) and Abstracts Views on Vision4Press platform.
Data correspond to usage on the plateform after 2015. The current usage metrics is available 48-96 hours after online publication and is updated daily on week days.
Initial download of the metrics may take a while.


