Fig. 5
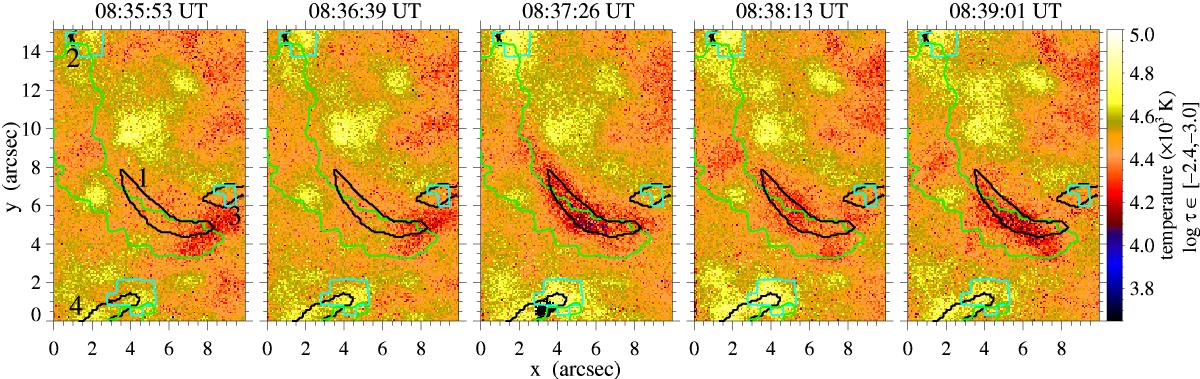
Average temperature scans 16–20 (left to right) inferred from the NICOLE inversions of the Ca ii 8542 Å line between the heights of log τ ∈ [−2.4,−3.0]. The time corresponds to the midpoint of each scan sequence. The impulsive phase starts at 08:37 UT. Overplotted black contours, marked with numbers 2–3 in the left-hand panel, show cumulative GFPI Ca ii line-core enhancements between 08:37–08:39 UT. The black contour marked with 1 encompasses a dark filamentary structure seen in the GFPI Ca ii line-core images. AIA 131 (green) and AIA 1600 Å (blue) contours show brightenings at 08:37:56 and 08:37:28 UT, respectively. The black area at the bottom of the panel at 08:37:26 UT does not show information on the inversions owing to bad fits (χ2 exceeds threshold criterion). The FOV corresponds to the black rectangles shown in the GFPI panels of Fig. 2.
Current usage metrics show cumulative count of Article Views (full-text article views including HTML views, PDF and ePub downloads, according to the available data) and Abstracts Views on Vision4Press platform.
Data correspond to usage on the plateform after 2015. The current usage metrics is available 48-96 hours after online publication and is updated daily on week days.
Initial download of the metrics may take a while.